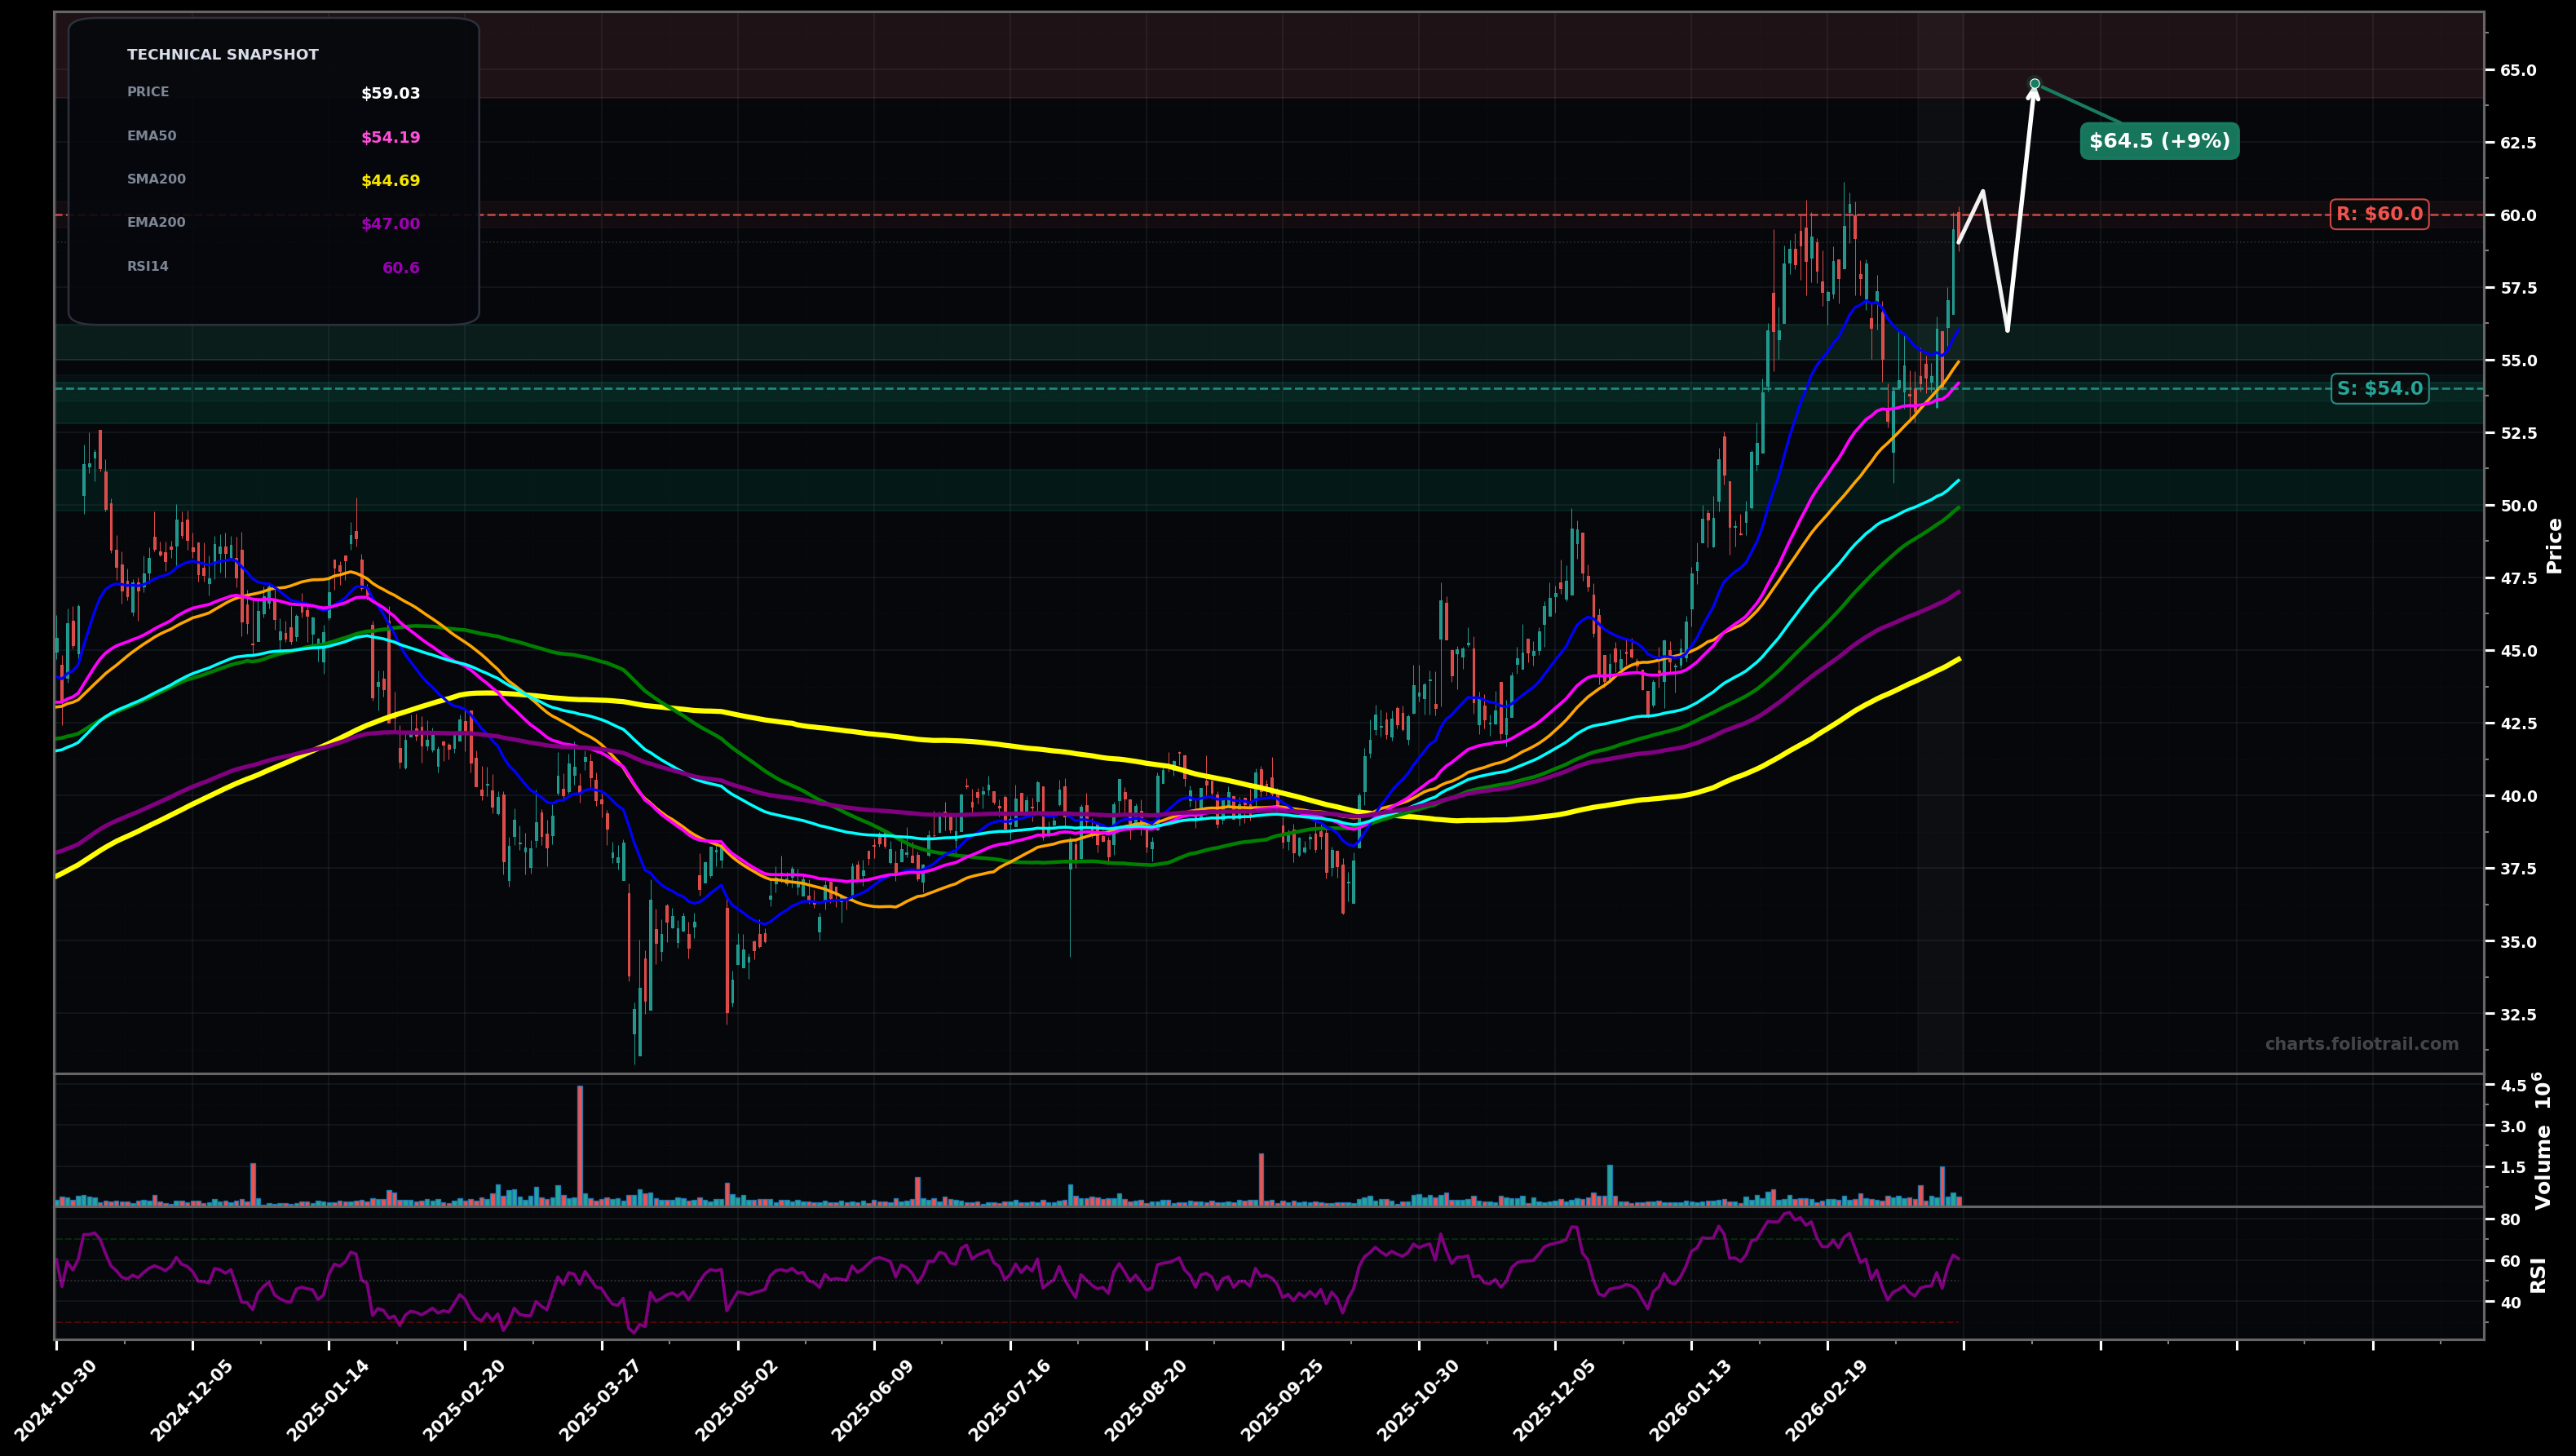
As of March 26, 2026, BHE (Benchmark Electronics Inc.) is in a uptrend state on the daily chart, with a confidence level of 72%. Key support is at $54.0 and key resistance at $60.0. Price at ~$59.03 is back near prior highs after a pullback, holding above rising EMA50/EMA100 and above SMA50; RSI ~60 shows bullish momentum but not extreme.
Bullish continuation: price consolidates above the $54-$56 MA cluster, then breaks $60 and extends higher (wave 5 / post-wave-4 continuation).
Deeper pullback / wave-4-style retrace: rejection near $60 leads to a drop into the ~$52-$54 zone; trend remains intact if buyers defend and print a higher low, otherwise risks a larger mean reversion toward the EMA100/SMA100 area.
2 daily closes above $60.00
Daily close below $54.00 (loss of EMA50/SMA50 confluence)
Buy-the-dip zones aligned to EMA50/SMA50 first, then prior breakout/support, then EMA100/SMA100 confluence (trend still bullish unless $54 fails hard).
Trim into likely extension levels above the ~$60 prior high (Fibo-style extensions / late-wave behavior); progressively reduce as price gets increasingly stretched above the rising EMA50/EMA100.
As of March 26, 2026, BHE (Benchmark Electronics Inc.) is in a uptrend state on the daily chart with 72% confidence. Price at ~$59.03 is back near prior highs after a pullback, holding above rising EMA50/EMA100 and above SMA50; RSI ~60 shows bullish momentum but not extreme.
On the daily timeframe, BHE has key support at $54.0 and key resistance at $60.0. The most likely scenario (bullish) targets $60.8 and $64.5, with a revert level at $56.0.
BHE (Benchmark Electronics Inc.) is currently classified as uptrend on the daily chart, with 72% confidence. Confirmation requires: 2 daily closes above $60.00 This would be invalidated by: Daily close below $54.00 (loss of EMA50/SMA50 confluence)
The most likely scenario (bullish) targets $60.8 and $64.5, with a revert level at $56.0. The alternative scenario (bearish) targets $53.0 and $50.8.
Multi-layer AI agents analyse 200+ stocks across daily, weekly, and monthly timeframes — producing market state classifications, price scenarios with targets, and position entry/exit levels. Updated every trading day after market close. No paywall. No sign-up required.
Built by Foliotrail.
All content on this website — including charts, analysis, price targets, support/resistance levels, and position zones — is generated entirely by AI and provided for educational and informational purposes only.
This is not financial advice. NEXUSNOIR VENTURES SL (the operator of this website) is not a registered investment adviser or broker-dealer. You should not make investment decisions based solely on this information. Always do your own research and consult a qualified financial advisor.
By continuing, you acknowledge that you have read and agree to our full disclaimer & terms of use and privacy policy.