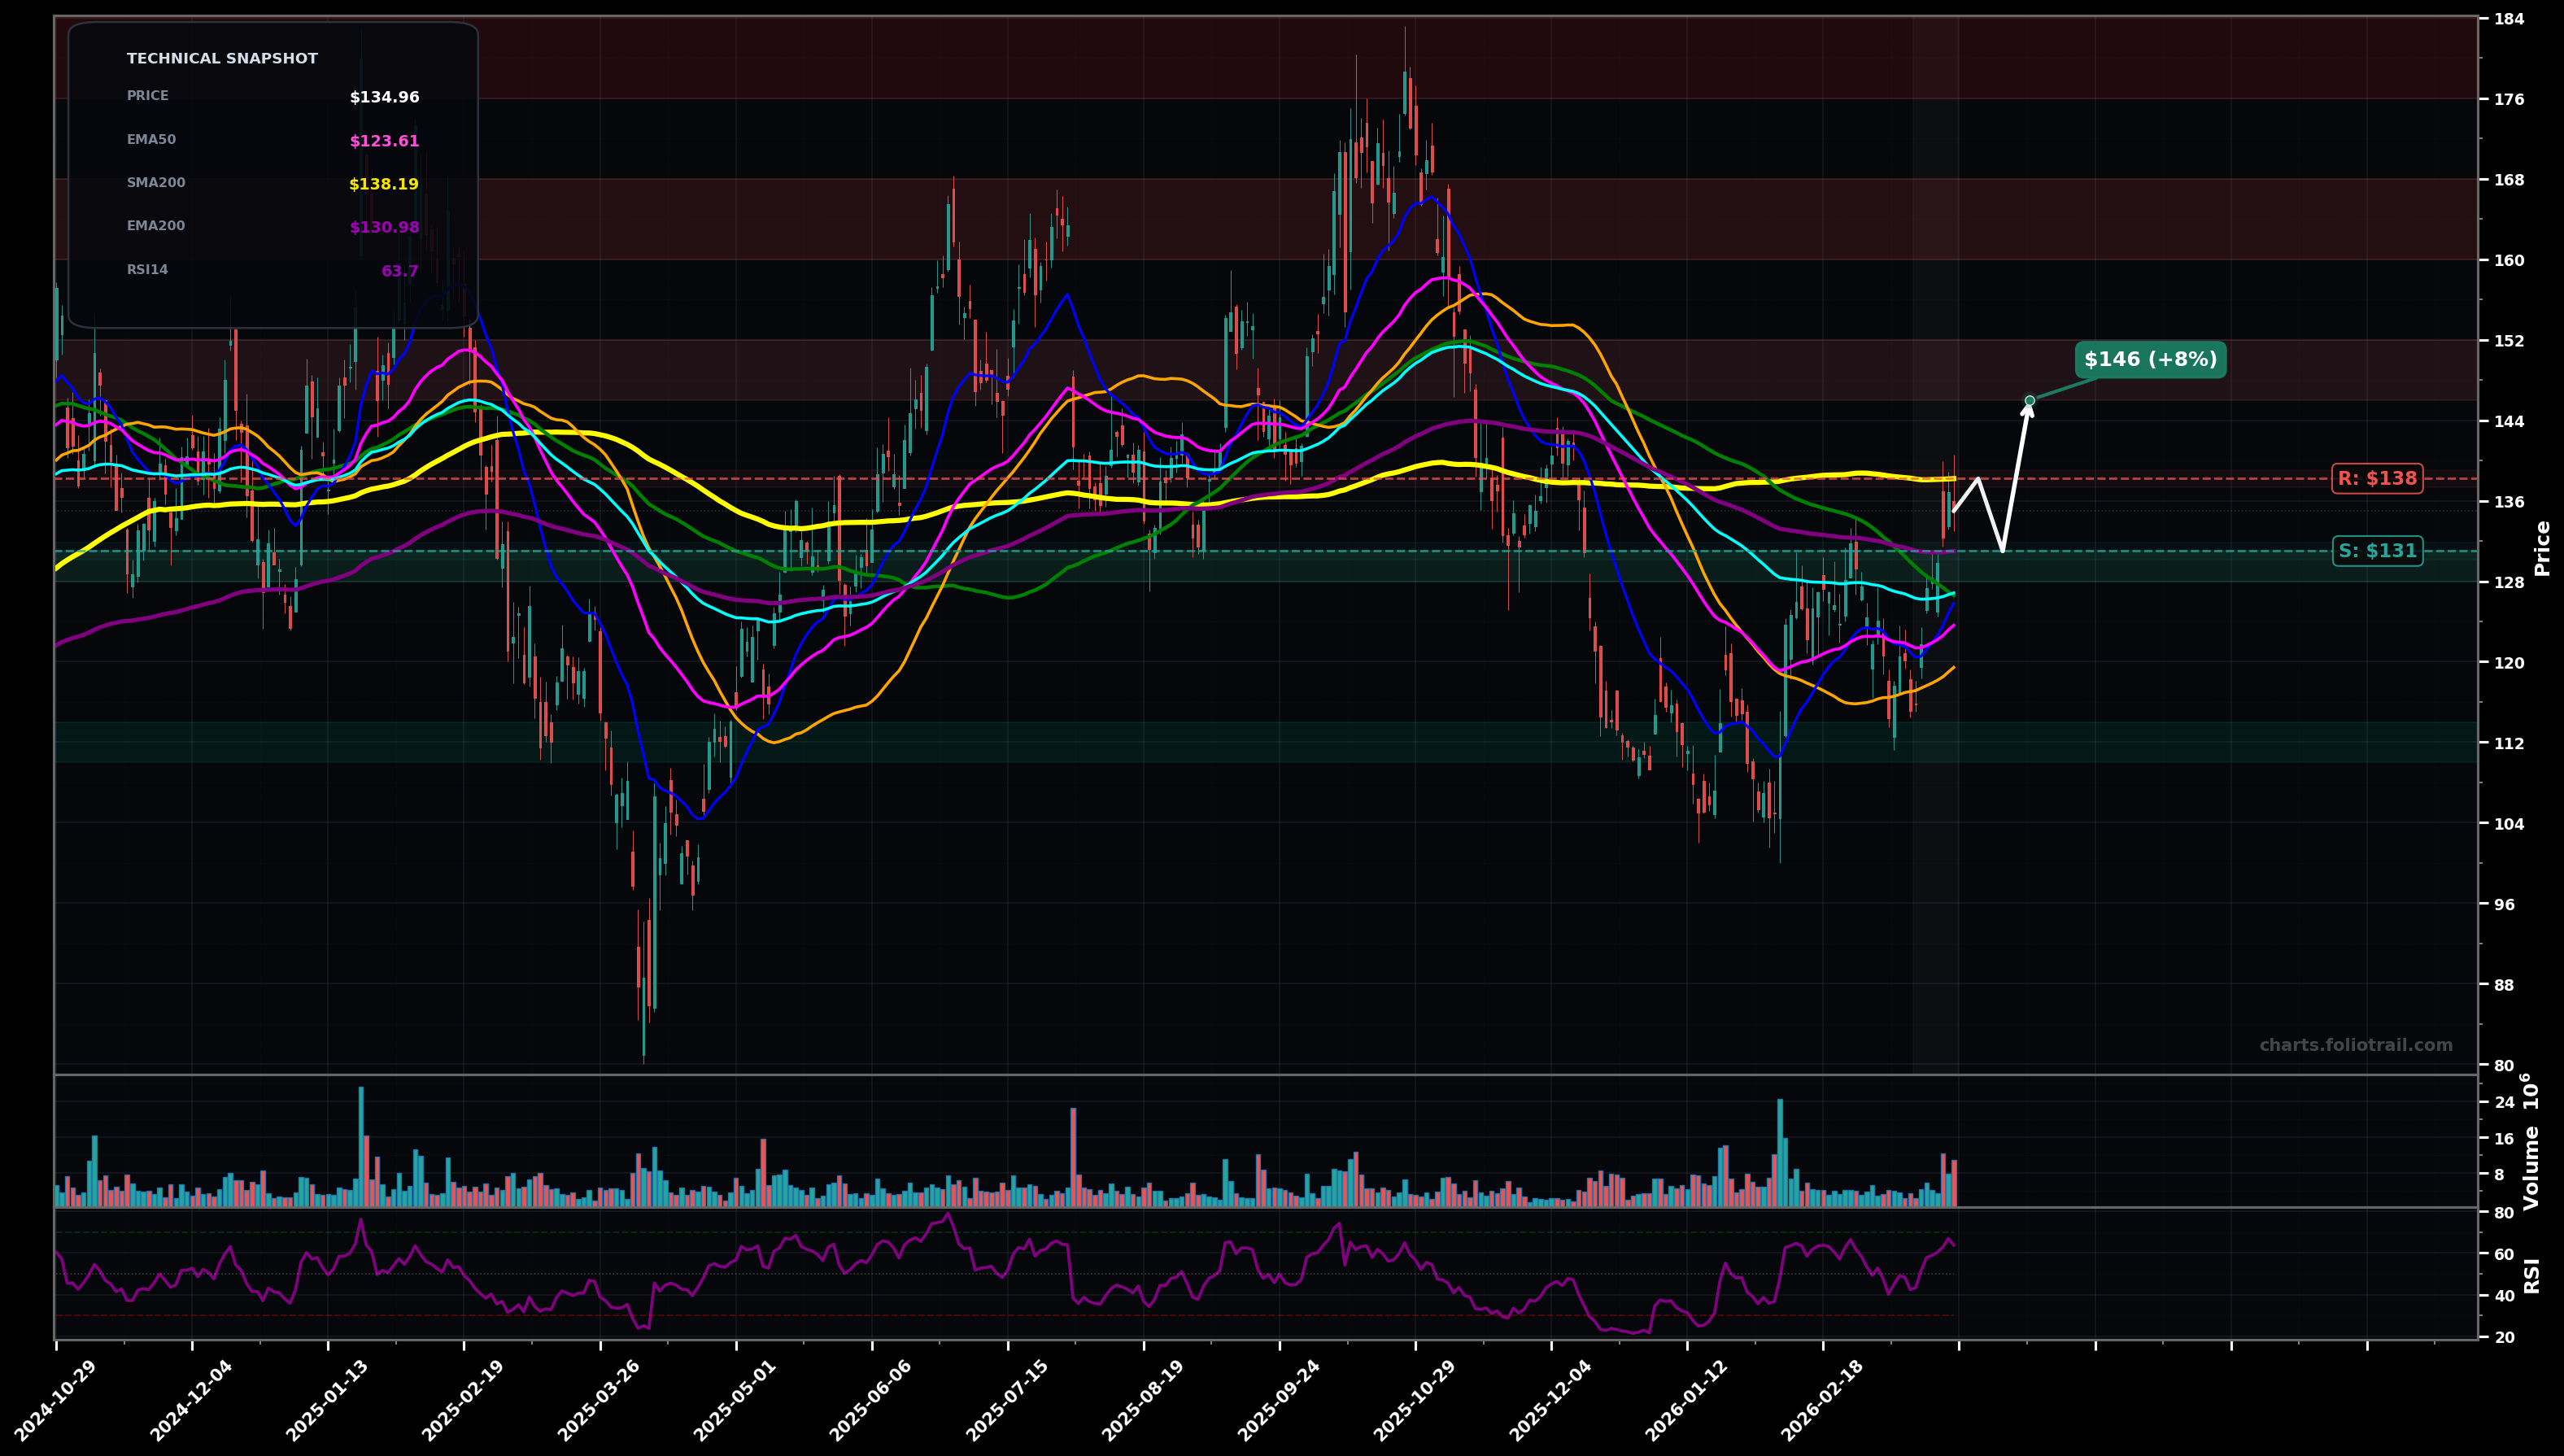
As of March 25, 2026, ARM (Arm Holdings plc) is in a bottoming attempt state on the daily chart, with a confidence level of 63%. Key support is at $131 and key resistance at $138. Sharp rebound from the ~$110 swing low; price $134.96 is now pushing into the $135-$138 supply/MA cluster with RSI ~64 (near short-term overbought zone).
Base-to-reversal attempt continues: brief pullback/retest holds above the $131 area (EMA200/near breakout shelf), then a push through $138 opens a move into the low-$140s and potentially the prior breakdown zone.
Rejection at the $135-$138 MA band: price fails at SMA200 and rolls over, retracing the bounce back toward the fast MAs; if $123 breaks, it risks a larger mean reversion toward the prior base.
2+ daily closes above $138.20 (SMA200) with holds (no immediate reversal back below).
Daily close back below $123.60 (EMA50) would negate the current recovery structure.
Buy dips toward reclaimed structure/EMA200 first ($128-$131); add on EMA50/EMA100 confluence ($123-$127); heavy add only on a deeper retest of the major swing-low demand (~$110) if it holds.
Trim into prior distribution/major swing resistance zones (likely Fib retracement + prior highs): first at ~$146-152, more at ~$160-168, and fully exit into ~$176-184 if price becomes extended versus the long MAs.
As of March 25, 2026, ARM (Arm Holdings plc) is in a bottoming attempt state on the daily chart with 63% confidence. Sharp rebound from the ~$110 swing low; price $134.96 is now pushing into the $135-$138 supply/MA cluster with RSI ~64 (near short-term overbought zone).
On the daily timeframe, ARM has key support at $131 and key resistance at $138. The most likely scenario (bullish) targets $138 and $146, with a revert level at $131.
ARM (Arm Holdings plc) is currently classified as bottoming attempt on the daily chart, with 63% confidence. Confirmation requires: 2+ daily closes above $138.20 (SMA200) with holds (no immediate reversal back below). This would be invalidated by: Daily close back below $123.60 (EMA50) would negate the current recovery structure.
The most likely scenario (bullish) targets $138 and $146, with a revert level at $131. The alternative scenario (bearish) targets $127 and $118.
Multi-layer AI agents analyse 200+ stocks across daily, weekly, and monthly timeframes — producing market state classifications, price scenarios with targets, and position entry/exit levels. Updated every trading day after market close. No paywall. No sign-up required.
Built by Foliotrail.
All content on this website — including charts, analysis, price targets, support/resistance levels, and position zones — is generated entirely by AI and provided for educational and informational purposes only.
This is not financial advice. NEXUSNOIR VENTURES SL (the operator of this website) is not a registered investment adviser or broker-dealer. You should not make investment decisions based solely on this information. Always do your own research and consult a qualified financial advisor.
By continuing, you acknowledge that you have read and agree to our full disclaimer & terms of use and privacy policy.