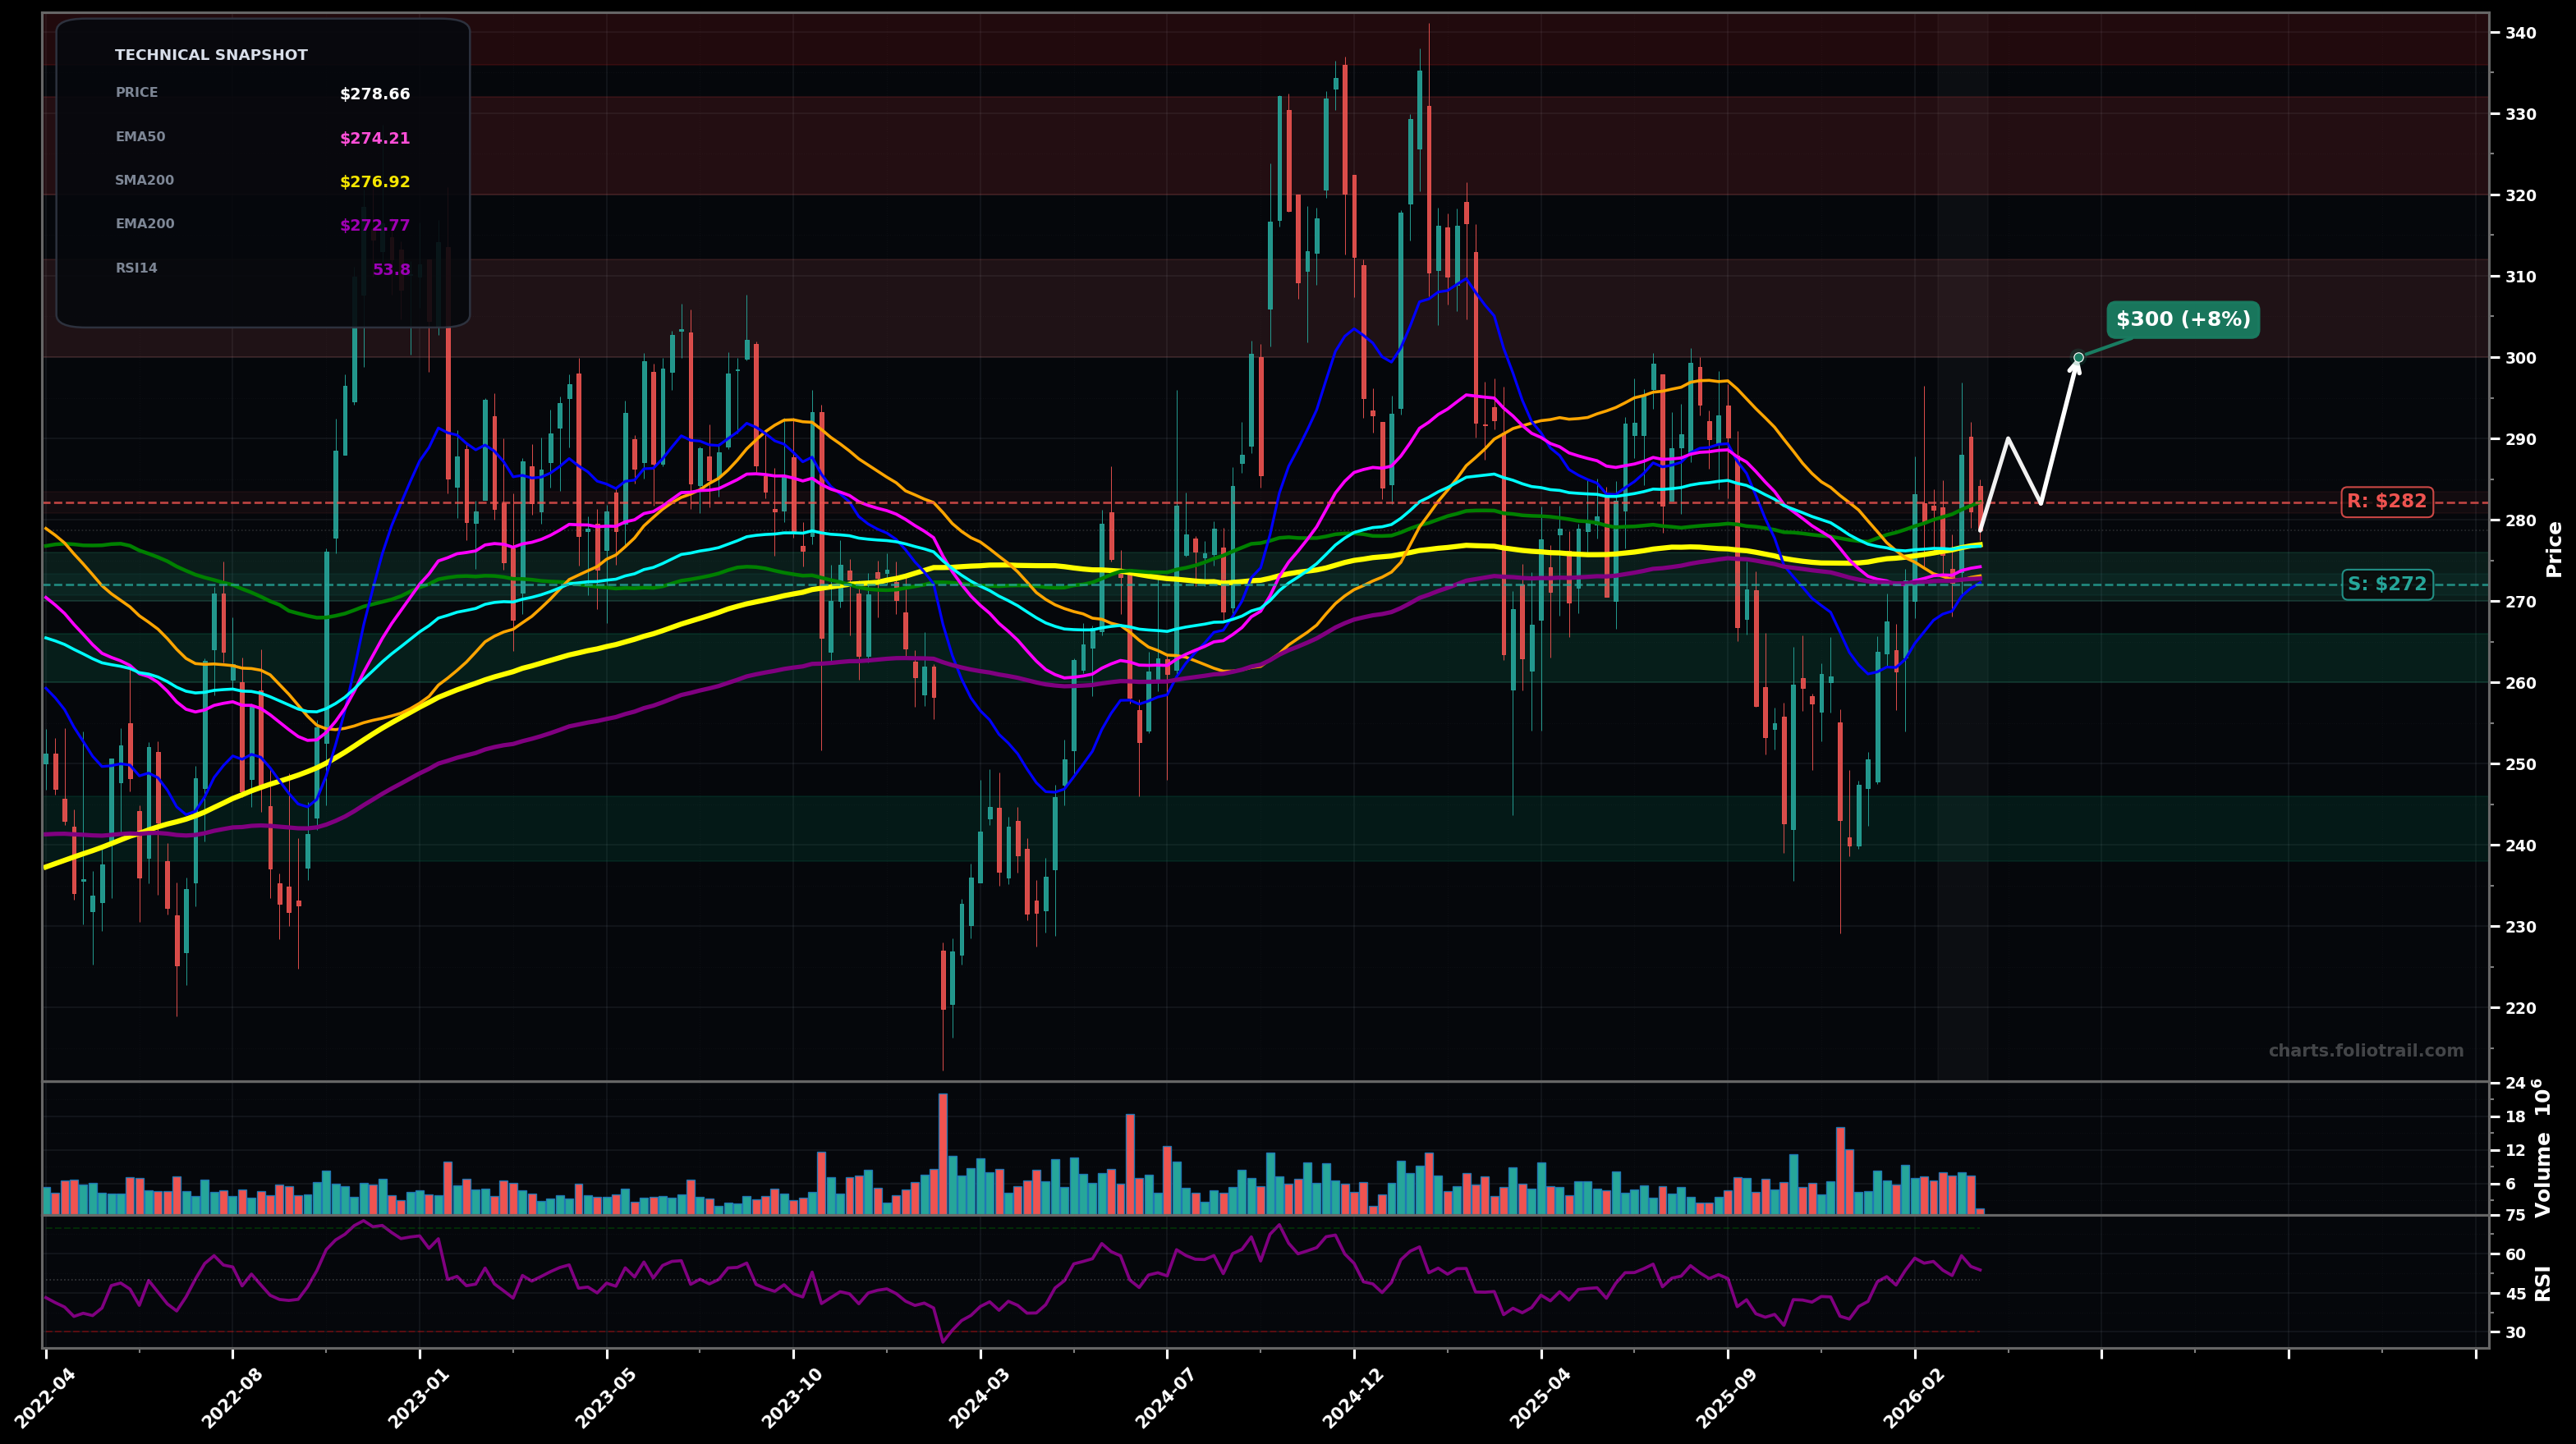
As of March 24, 2026, APD (Air Products and Chemicals Inc.) is in a choppy range state on the weekly chart, with a confidence level of 66%. Key support is at $272 and key resistance at $282. Price is grinding back up into the clustered MAs around $276-$282 after a bounce from the ~$240 swing low; momentum mid-range (RSI ~54) and candles overlap (range-bound behavior).
Range continues but with slight bullish bias: hold above the $272-$276 MA cluster, then press through $282 and mean-revert upward toward the next supply zone.
Failed reclaim: rejection at $282 and breakdown back under the MA cluster, leading to a retest of the prior swing-low zone and possible undercut-and-rally attempt.
2+ weekly closes above $282.15 (SMA100) with a push toward $290+ would confirm an upside resolution
Weekly close below $272.00 (loss of MA cluster/failed reclaim) would invalidate the choppy-range bias and tilt bearish
Start near the MA cluster (EMA100/SMA200 confluence), add on first deeper support retest, heavy add only at the prior swing-low demand zone (~$240) if reached.
Trim into prior overhead supply from the $300-$330 area; fully close into the upper weekly swing/supply band near the prior extremes (~$340+).
As of March 24, 2026, APD (Air Products and Chemicals Inc.) is in a choppy range state on the weekly chart with 66% confidence. Price is grinding back up into the clustered MAs around $276-$282 after a bounce from the ~$240 swing low; momentum mid-range (RSI ~54) and candles overlap (range-bound behavior).
On the weekly timeframe, APD has key support at $272 and key resistance at $282. The most likely scenario (bullish) targets $290 and $300, with a revert level at $282.
APD (Air Products and Chemicals Inc.) is currently classified as choppy range on the weekly chart, with 66% confidence. Confirmation requires: 2+ weekly closes above $282.15 (SMA100) with a push toward $290+ would confirm an upside resolution This would be invalidated by: Weekly close below $272.00 (loss of MA cluster/failed reclaim) would invalidate the choppy-range bias and tilt bearish
The most likely scenario (bullish) targets $290 and $300, with a revert level at $282. The alternative scenario (bearish) targets $260 and $240.
All content on this website — including charts, analysis, price targets, support/resistance levels, and position zones — is generated entirely by AI and provided for educational and informational purposes only.
This is not financial advice. NEXUSNOIR VENTURES SL (the operator of this website) is not a registered investment adviser or broker-dealer. You should not make investment decisions based solely on this information. Always do your own research and consult a qualified financial advisor.
By continuing, you acknowledge that you have read and agree to our full disclaimer & terms of use and privacy policy.