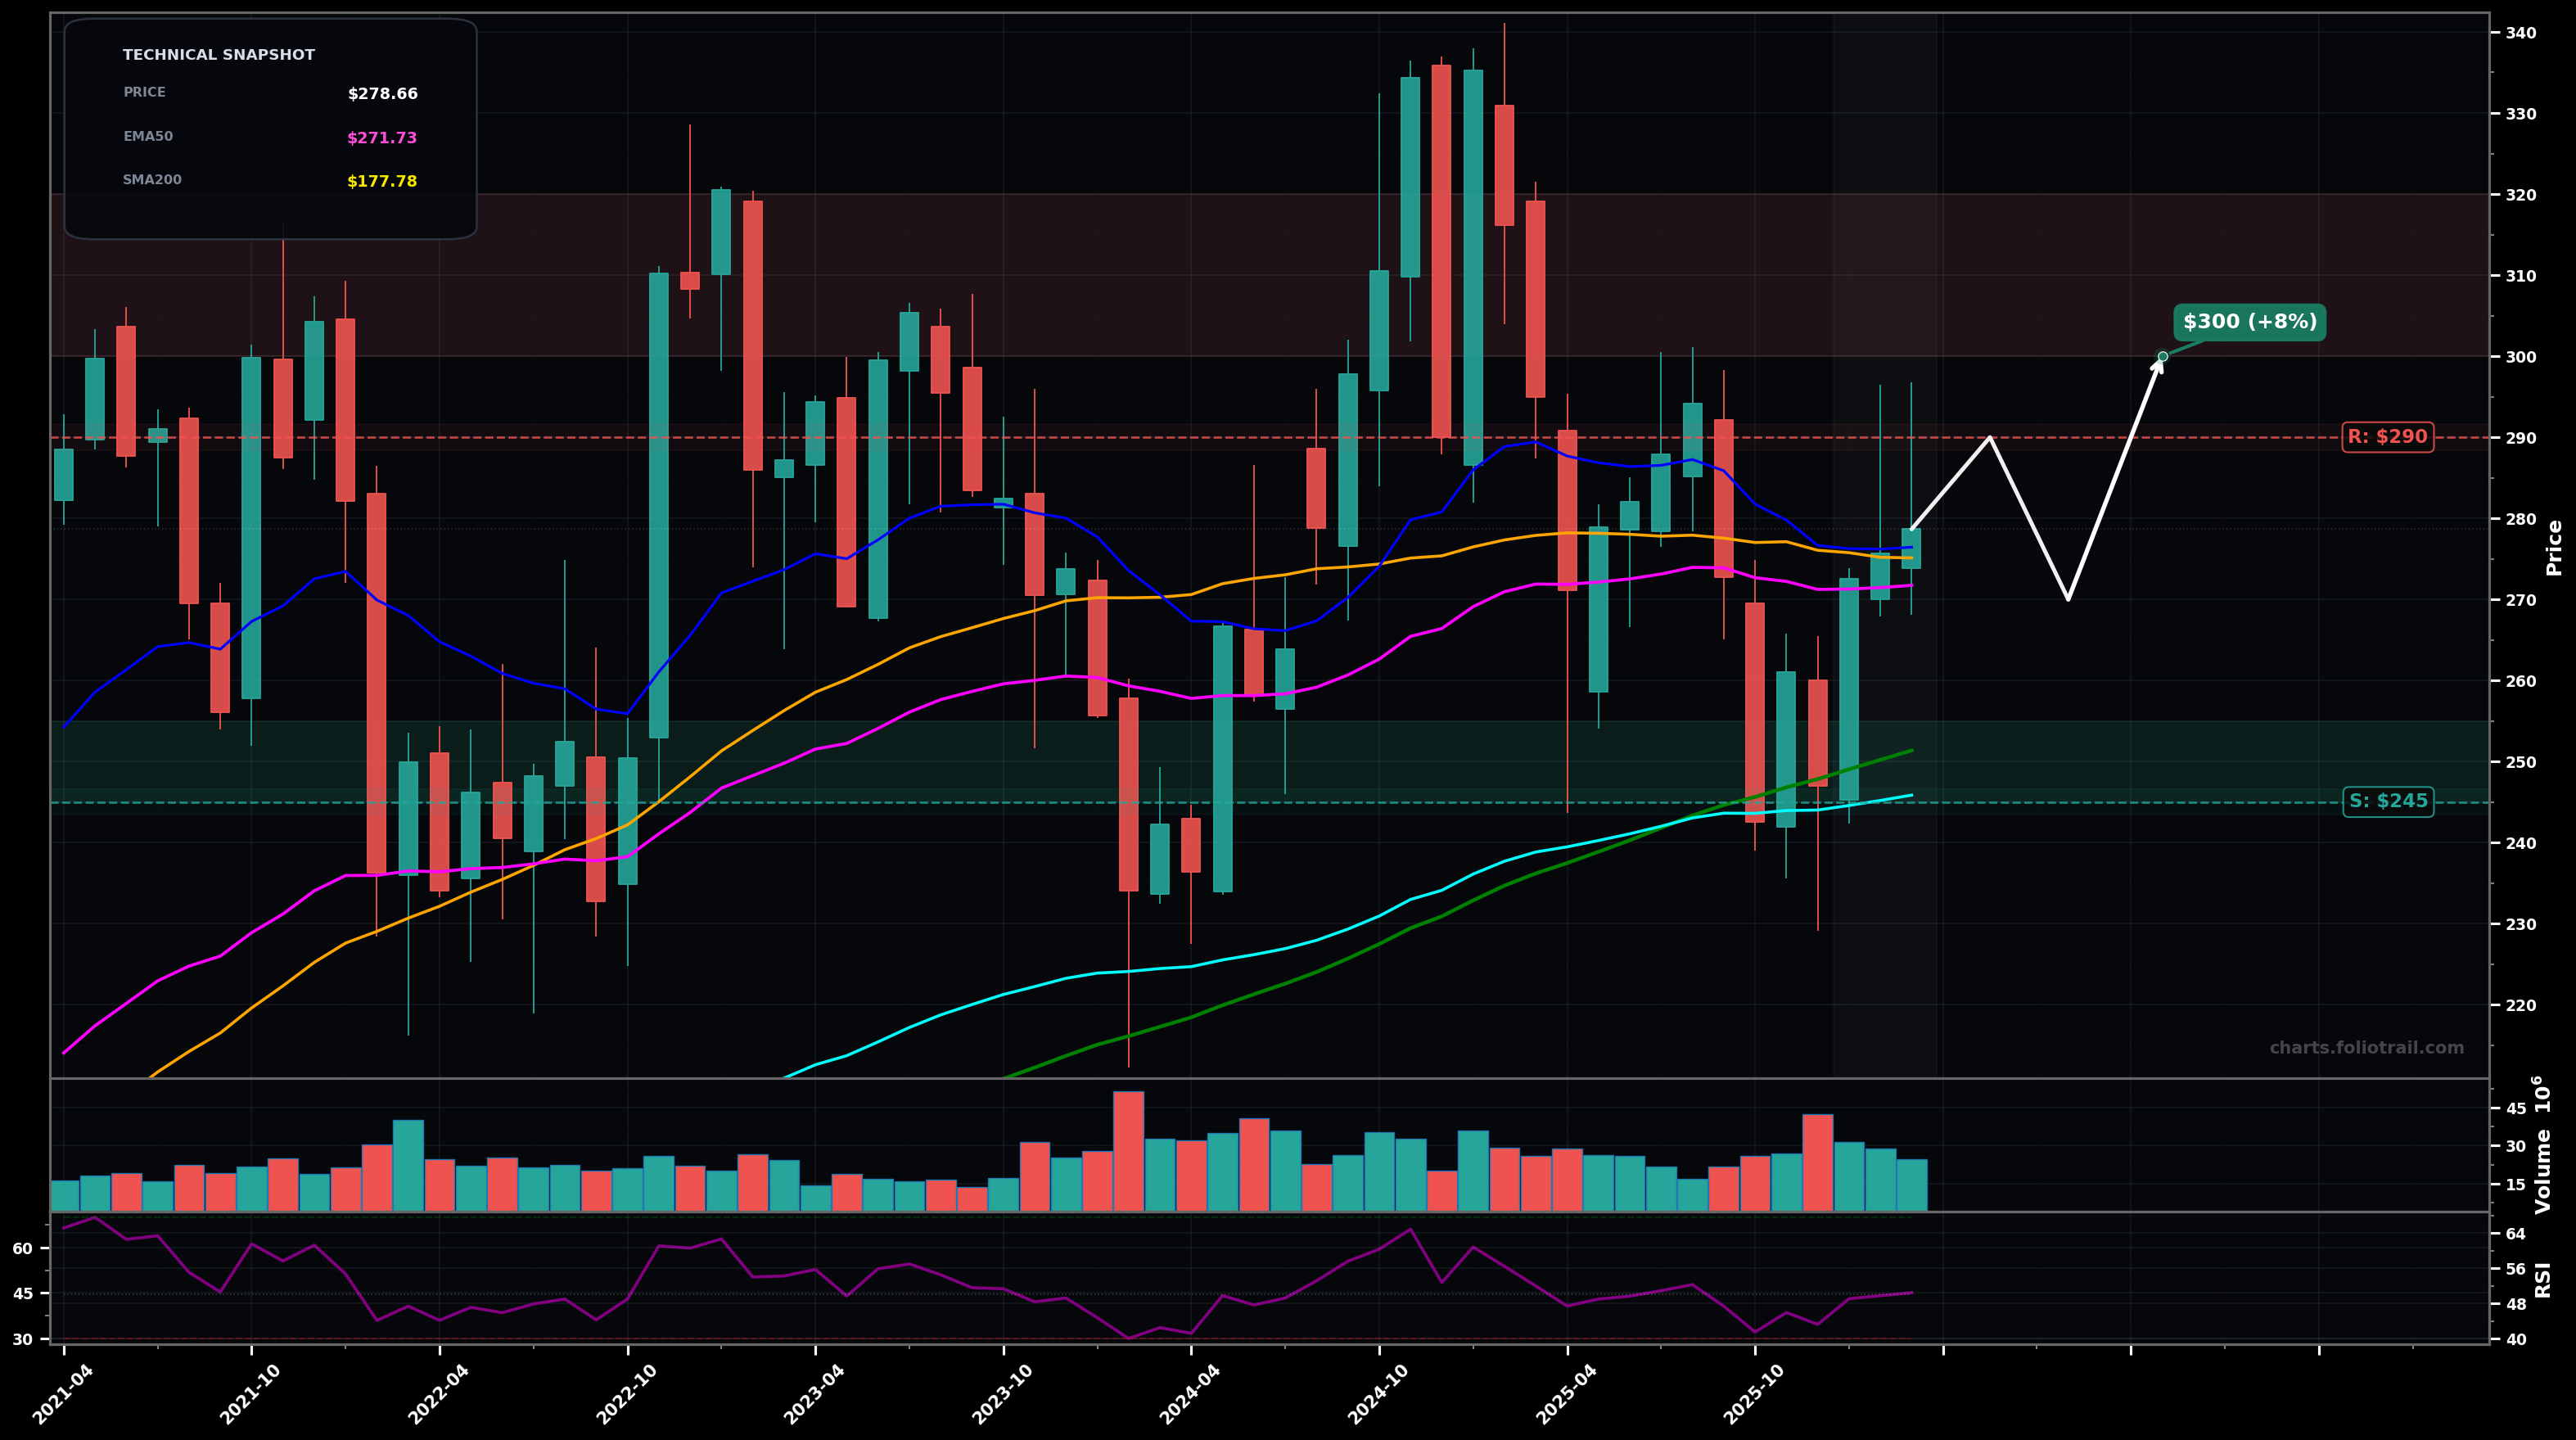
As of March 24, 2026, APD (Air Products and Chemicals Inc.) is in a choppy range state on the monthly chart, with a confidence level of 62%. Key support is at $245 and key resistance at $290. Monthly bounced from the $240-$245 demand area and is now consolidating around the $275-$280 cluster (near SMA50/EMA20/EMA50) with RSI ~50 (neutral).
Range continuation: price chops between the $245 support (EMA100/SMA100 area) and $290-$300 supply; a push to $290 is likely, but expect rejection unless it can close above $300.
Breakdown scenario: loss of the $245-$240 swing-low reference region triggers a deeper retrace toward the rising long-term averages; that would fit a larger Elliott corrective leg (C-wave) from the $340 top.
CHOPPY_RANGE confirmed while price holds between $240 and $295 on monthly closes
Invalidated by a monthly close above $300 (breakout) or below $240 (breakdown)
Start near EMA100/SMA100 confluence ($245-$255); add on a deeper Fibonacci-style retrace into prior demand ($225-$240); heavy add near EMA200 (~$196) + psychological $200.
Trim into overhead supply and prior top zone ($300-$350); close only if price becomes clearly stretched beyond the prior $340 peak into an extended Elliott Wave 5-style blowoff.
As of March 24, 2026, APD (Air Products and Chemicals Inc.) is in a choppy range state on the monthly chart with 62% confidence. Monthly bounced from the $240-$245 demand area and is now consolidating around the $275-$280 cluster (near SMA50/EMA20/EMA50) with RSI ~50 (neutral).
On the monthly timeframe, APD has key support at $245 and key resistance at $290. The most likely scenario (bullish) targets $290 and $300, with a revert level at $270.
APD (Air Products and Chemicals Inc.) is currently classified as choppy range on the monthly chart, with 62% confidence. Confirmation requires: CHOPPY_RANGE confirmed while price holds between $240 and $295 on monthly closes This would be invalidated by: Invalidated by a monthly close above $300 (breakout) or below $240 (breakdown)
The most likely scenario (bullish) targets $290 and $300, with a revert level at $270. The alternative scenario (bearish) targets $240 and $200.
All content on this website — including charts, analysis, price targets, support/resistance levels, and position zones — is generated entirely by AI and provided for educational and informational purposes only.
This is not financial advice. NEXUSNOIR VENTURES SL (the operator of this website) is not a registered investment adviser or broker-dealer. You should not make investment decisions based solely on this information. Always do your own research and consult a qualified financial advisor.
By continuing, you acknowledge that you have read and agree to our full disclaimer & terms of use and privacy policy.