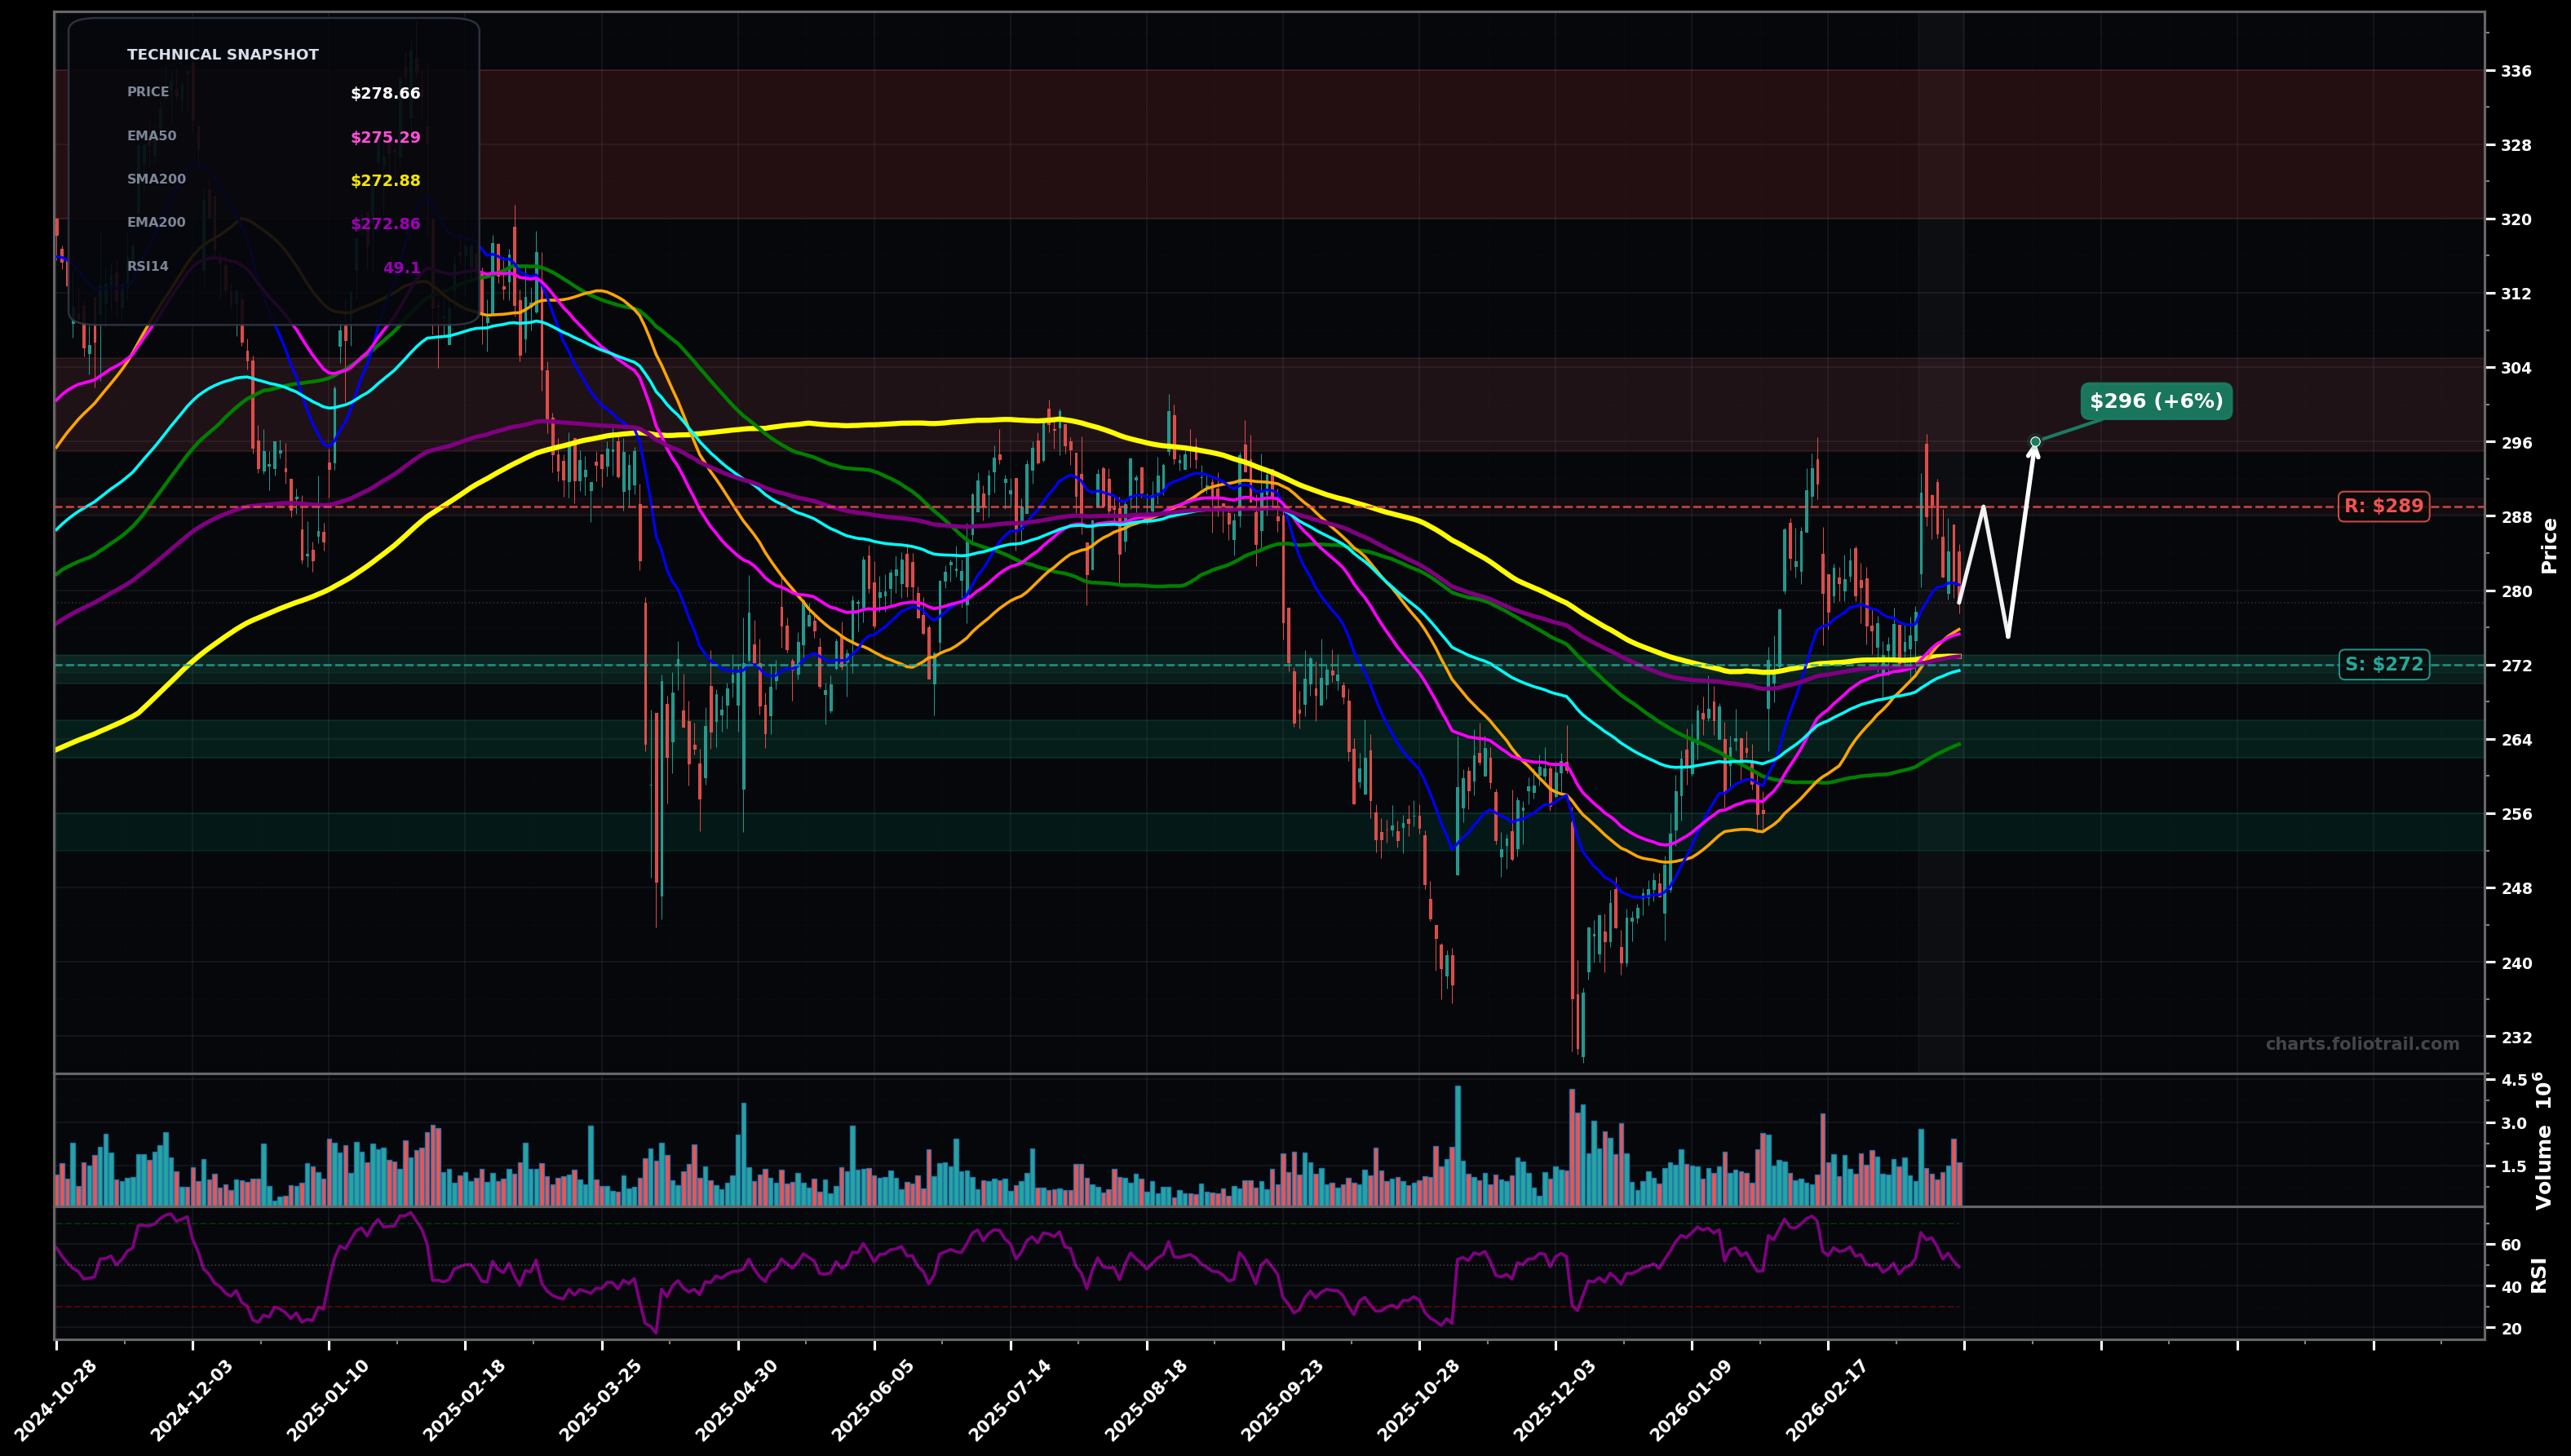
As of March 24, 2026, APD (Air Products and Chemicals Inc.) is in a choppy range state on the daily chart, with a confidence level of 63%. Key support is at $272 and key resistance at $289. Price at ~$278.66 is chopping just above the rising/flattening EMA50 (~$275.6) and SMA50 (~$275.8) after a strong rebound from the ~$232 swing low; momentum is neutral (RSI ~49).
Range continues: pullback/consolidation holds above ~$272, then another attempt to push into the ~$289-$296 supply zone; likely rejection initially unless volume expands.
Failed hold: breakdown under ~$272 leads to a mean-reversion move toward the next support shelf near the prior base/MA area; buyers likely show up near the next pivot zone.
CHOPPY_RANGE confirmed while price holds between ~$272 and ~$289 with repeated reversals
Invalidated on a daily close above ~$296 (break and hold above the recent swing high/overhead MA band) OR below ~$264 (loss of the post-rally higher-low structure)
Start near EMA50/SMA50 support (~$272); add on breakdown-to-support at prior consolidation (~$264); heavy add near deeper retrace/next demand shelf (~$252-$256) if volatility expands.
Trim into the overhead MA/supply zone first (~$296-$305), then more aggressively if price stretches far above long MAs into prior distribution highs (~$320+); full exit only on extreme extension beyond prior major highs.
As of March 24, 2026, APD (Air Products and Chemicals Inc.) is in a choppy range state on the daily chart with 63% confidence. Price at ~$278.66 is chopping just above the rising/flattening EMA50 (~$275.6) and SMA50 (~$275.8) after a strong rebound from the ~$232 swing low; momentum is neutral (RSI ~49).
On the daily timeframe, APD has key support at $272 and key resistance at $289. The most likely scenario (bullish) targets $289 and $296, with a revert level at $275.
APD (Air Products and Chemicals Inc.) is currently classified as choppy range on the daily chart, with 63% confidence. Confirmation requires: CHOPPY_RANGE confirmed while price holds between ~$272 and ~$289 with repeated reversals This would be invalidated by: Invalidated on a daily close above ~$296 (break and hold above the recent swing high/overhead MA band) OR below ~$264 (loss of the post-rally higher-low structure)
The most likely scenario (bullish) targets $289 and $296, with a revert level at $275. The alternative scenario (bearish) targets $264 and $256.
All content on this website — including charts, analysis, price targets, support/resistance levels, and position zones — is generated entirely by AI and provided for educational and informational purposes only.
This is not financial advice. NEXUSNOIR VENTURES SL (the operator of this website) is not a registered investment adviser or broker-dealer. You should not make investment decisions based solely on this information. Always do your own research and consult a qualified financial advisor.
By continuing, you acknowledge that you have read and agree to our full disclaimer & terms of use and privacy policy.