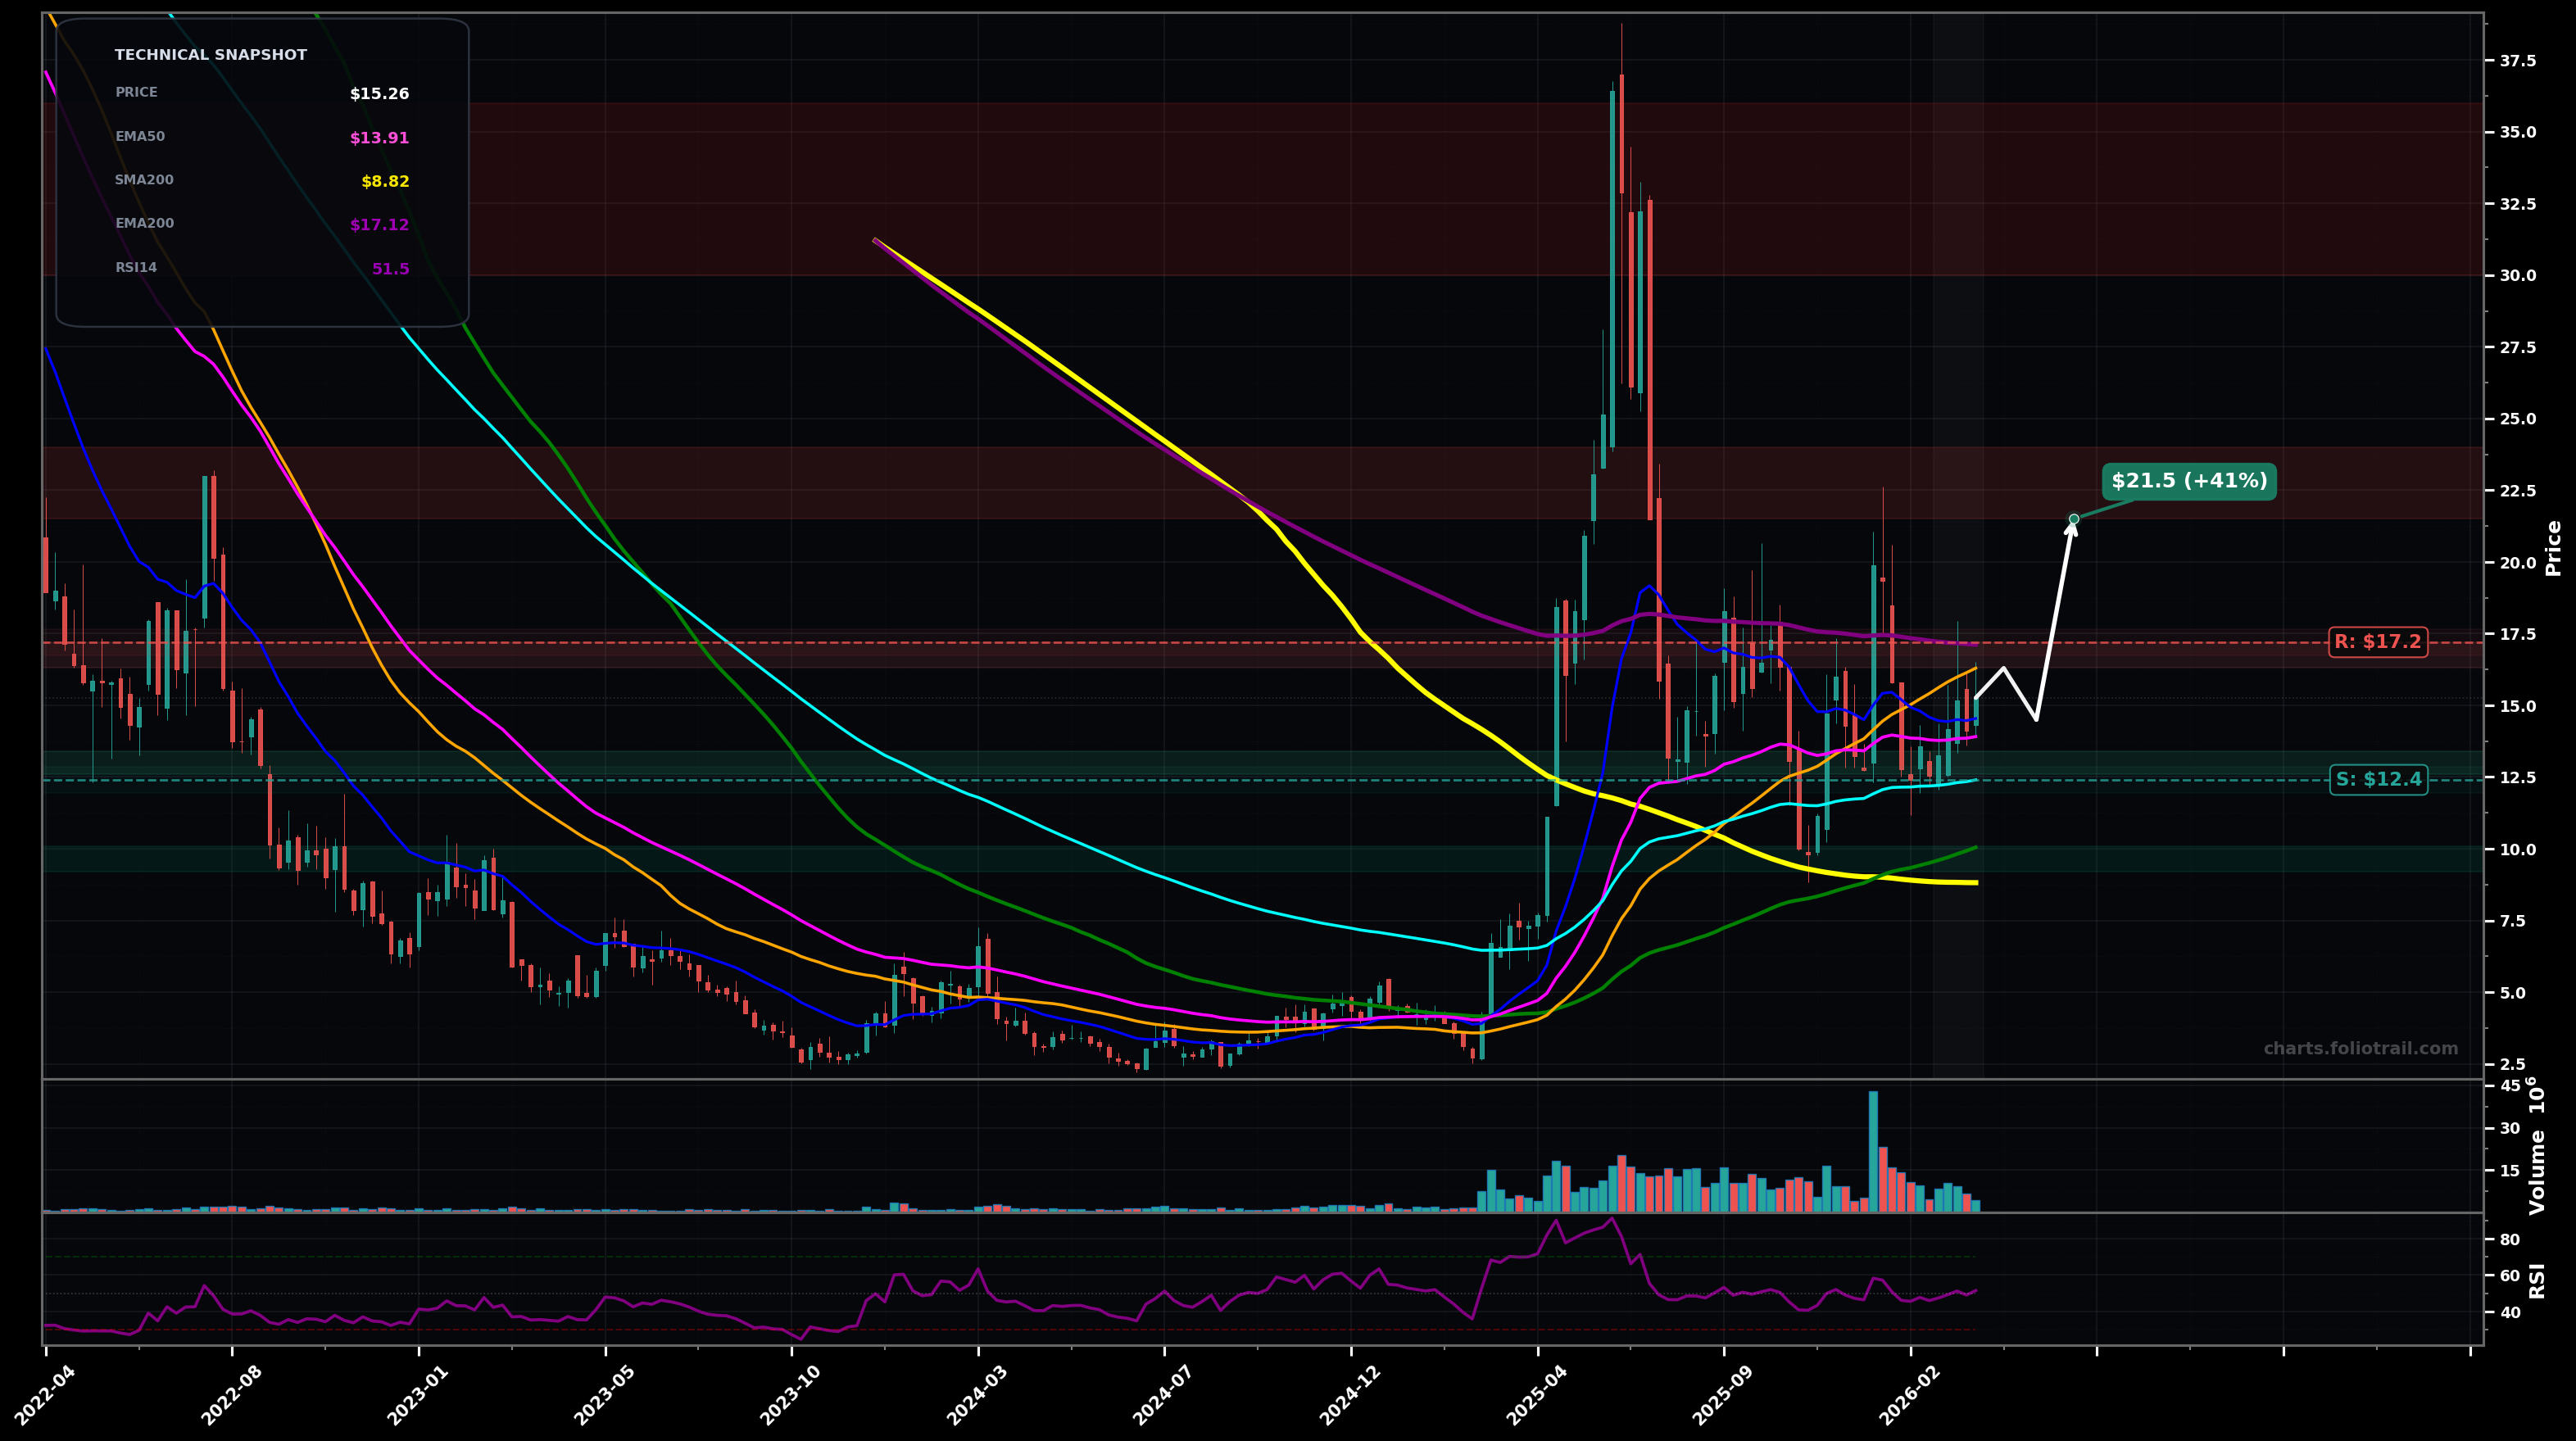
As of March 26, 2026, AEVA (Aeva Technologies, Inc.) is in a choppy range state on the weekly chart, with a confidence level of 66%. Key support is at $12.4 and key resistance at $17.2. Price is coiling around the short-term MAs after a sharp run-up and deep pullback; weekly closes are holding above the rising EMA100 (~$12.40) but still below the heavy EMA200/SMA50 cluster (~$16–$17).
Range continuation with a slight bullish bias: hold $12.40–$13.00, grind up through $16.30, then test the $17.20 supply; if accepted, extension toward the low-$20s (prior breakdown area).
Rejection at $16.30–$17.20 followed by breakdown: lose EMA100 and revisit the base support near the long-term SMA200 region; this would likely turn structure back to LH/LL on weekly swings.
2+ weekly closes above $17.20 (reclaim EMA200/SMA50 cluster)
Weekly close below $12.40 (lose EMA100)
Start near EMA100/weekly demand; add on confirmed dip into prior pivot support; heavy add only near SMA100 (~$10.05) where risk/reward improves if the range fails.
Trim into EMA200/SMA50 supply, trim more into the $21–$24 prior distribution area, and fully close into the blow-off zone near the prior spike highs (~$30–$36).
As of March 26, 2026, AEVA (Aeva Technologies, Inc.) is in a choppy range state on the weekly chart with 66% confidence. Price is coiling around the short-term MAs after a sharp run-up and deep pullback; weekly closes are holding above the rising EMA100 (~$12.40) but still below the heavy EMA200/SMA50 cluster (~$16–$17).
On the weekly timeframe, AEVA has key support at $12.4 and key resistance at $17.2. The most likely scenario (bullish) targets $16.3 and $21.5, with a revert level at $14.5.
AEVA (Aeva Technologies, Inc.) is currently classified as choppy range on the weekly chart, with 66% confidence. Confirmation requires: 2+ weekly closes above $17.20 (reclaim EMA200/SMA50 cluster) This would be invalidated by: Weekly close below $12.40 (lose EMA100)
The most likely scenario (bullish) targets $16.3 and $21.5, with a revert level at $14.5. The alternative scenario (bearish) targets $12.4 and $10.1.
Multi-layer AI agents analyse 200+ stocks across daily, weekly, and monthly timeframes — producing market state classifications, price scenarios with targets, and position entry/exit levels. Updated every trading day after market close. No paywall. No sign-up required.
Built by Foliotrail.
All content on this website — including charts, analysis, price targets, support/resistance levels, and position zones — is generated entirely by AI and provided for educational and informational purposes only.
This is not financial advice. NEXUSNOIR VENTURES SL (the operator of this website) is not a registered investment adviser or broker-dealer. You should not make investment decisions based solely on this information. Always do your own research and consult a qualified financial advisor.
By continuing, you acknowledge that you have read and agree to our full disclaimer & terms of use and privacy policy.