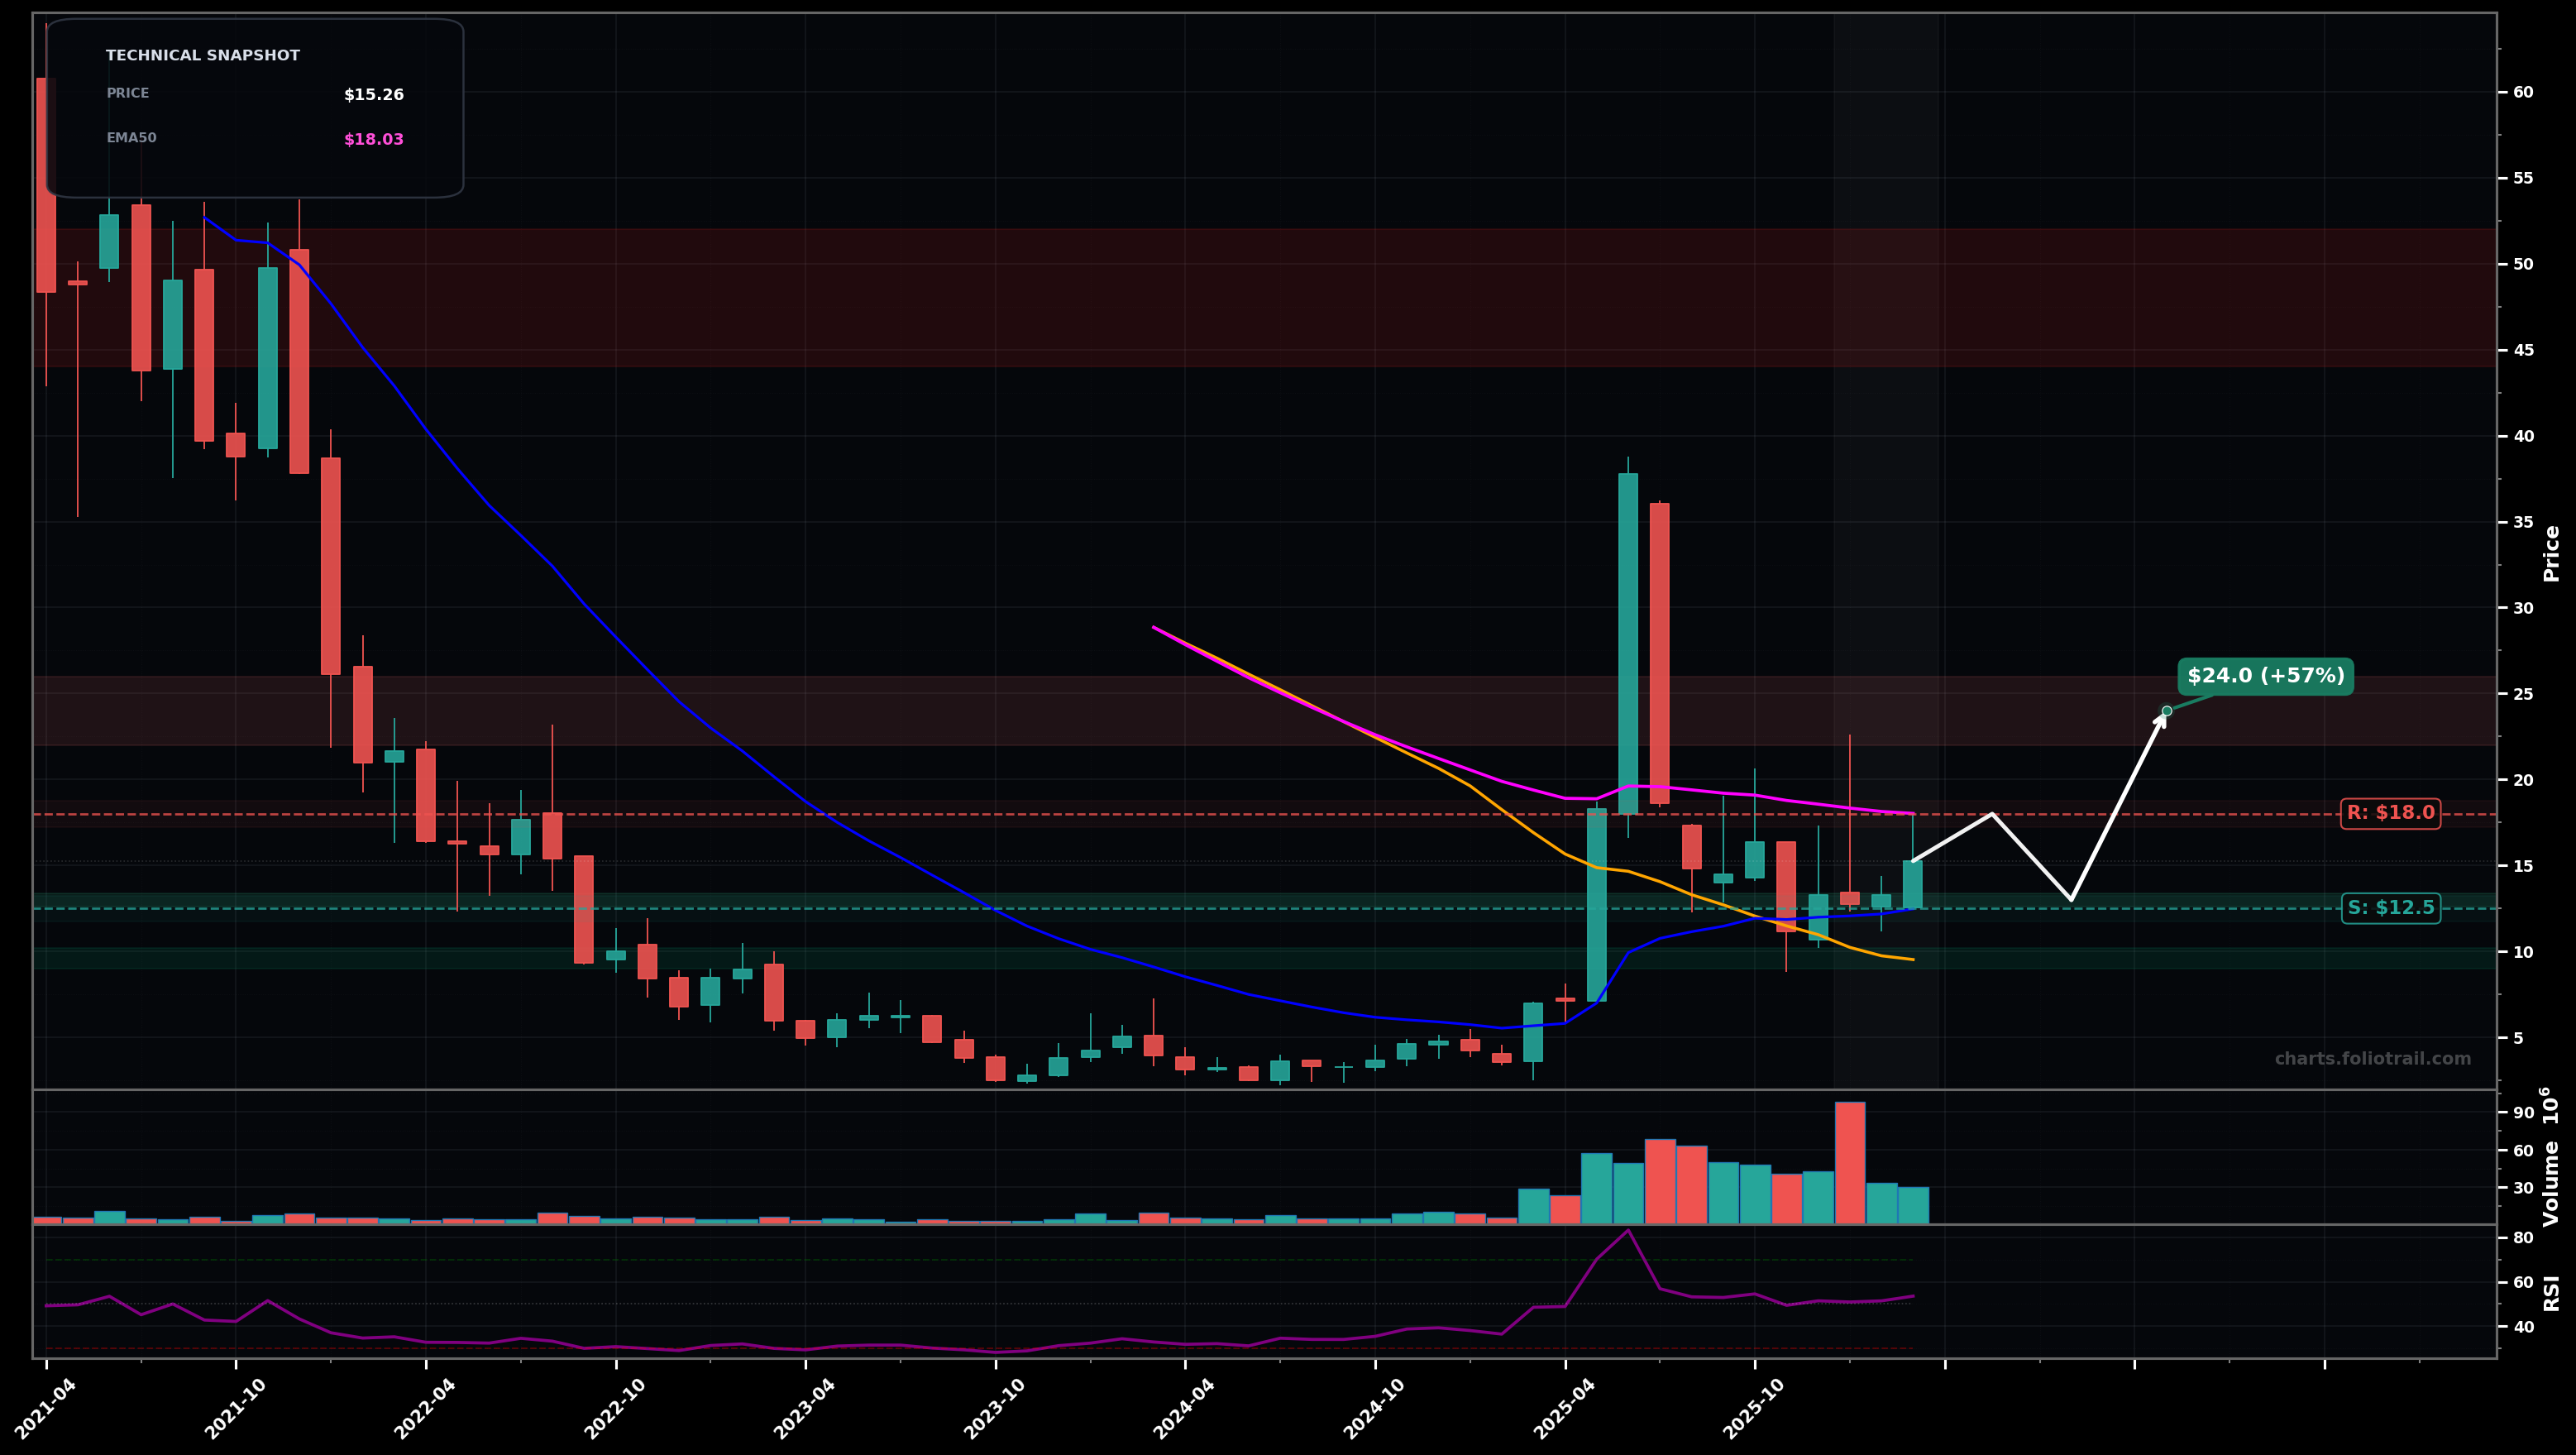
As of March 26, 2026, AEVA (Aeva Technologies, Inc.) is in a choppy range state on the monthly chart, with a confidence level of 64%. Key support is at $12.5 and key resistance at $18.0. Post-spike consolidation: price ~$15.26 holding above the ~$12-$13 area (EMA20) while still below the downward EMA50 (~$18.03); RSI ~53 suggests neutral-to-slightly constructive digestion.
Range continuation with a mild bullish bias: hold $12.50-$13.00, then press into $18.00; if $18.00 breaks on monthly closes, continuation toward the prior supply zone near $22-$25.
Bearish rejection at/under $18.00 followed by a breakdown under the $12.00-$12.50 base; mean reversion toward the lower consolidation shelf near $9-$10.
2+ monthly closes above $18.00 (EMA50 area) would confirm a breakout/reversal attempt
Monthly close below $12.00 would invalidate the range and tilt back to a bearish continuation
Stage-in around EMA20/support ($12-$13); add on confirmed base-loss but near next demand; heavy add only at deeper prior consolidation where downside tends to slow.
Trim into likely wave-(3)/(5) extension and fib/supply zones from the spike; progressively reduce as price re-enters the pre-2022 breakdown area and becomes increasingly stretched vs long MAs.
As of March 26, 2026, AEVA (Aeva Technologies, Inc.) is in a choppy range state on the monthly chart with 64% confidence. Post-spike consolidation: price ~$15.26 holding above the ~$12-$13 area (EMA20) while still below the downward EMA50 (~$18.03); RSI ~53 suggests neutral-to-slightly constructive digestion.
On the monthly timeframe, AEVA has key support at $12.5 and key resistance at $18.0. The most likely scenario (bullish) targets $18.0 and $24.0, with a revert level at $13.0.
AEVA (Aeva Technologies, Inc.) is currently classified as choppy range on the monthly chart, with 64% confidence. Confirmation requires: 2+ monthly closes above $18.00 (EMA50 area) would confirm a breakout/reversal attempt This would be invalidated by: Monthly close below $12.00 would invalidate the range and tilt back to a bearish continuation
The most likely scenario (bullish) targets $18.0 and $24.0, with a revert level at $13.0. The alternative scenario (bearish) targets $12.0 and $9.50.
Multi-layer AI agents analyse 200+ stocks across daily, weekly, and monthly timeframes — producing market state classifications, price scenarios with targets, and position entry/exit levels. Updated every trading day after market close. No paywall. No sign-up required.
Built by Foliotrail.
All content on this website — including charts, analysis, price targets, support/resistance levels, and position zones — is generated entirely by AI and provided for educational and informational purposes only.
This is not financial advice. NEXUSNOIR VENTURES SL (the operator of this website) is not a registered investment adviser or broker-dealer. You should not make investment decisions based solely on this information. Always do your own research and consult a qualified financial advisor.
By continuing, you acknowledge that you have read and agree to our full disclaimer & terms of use and privacy policy.