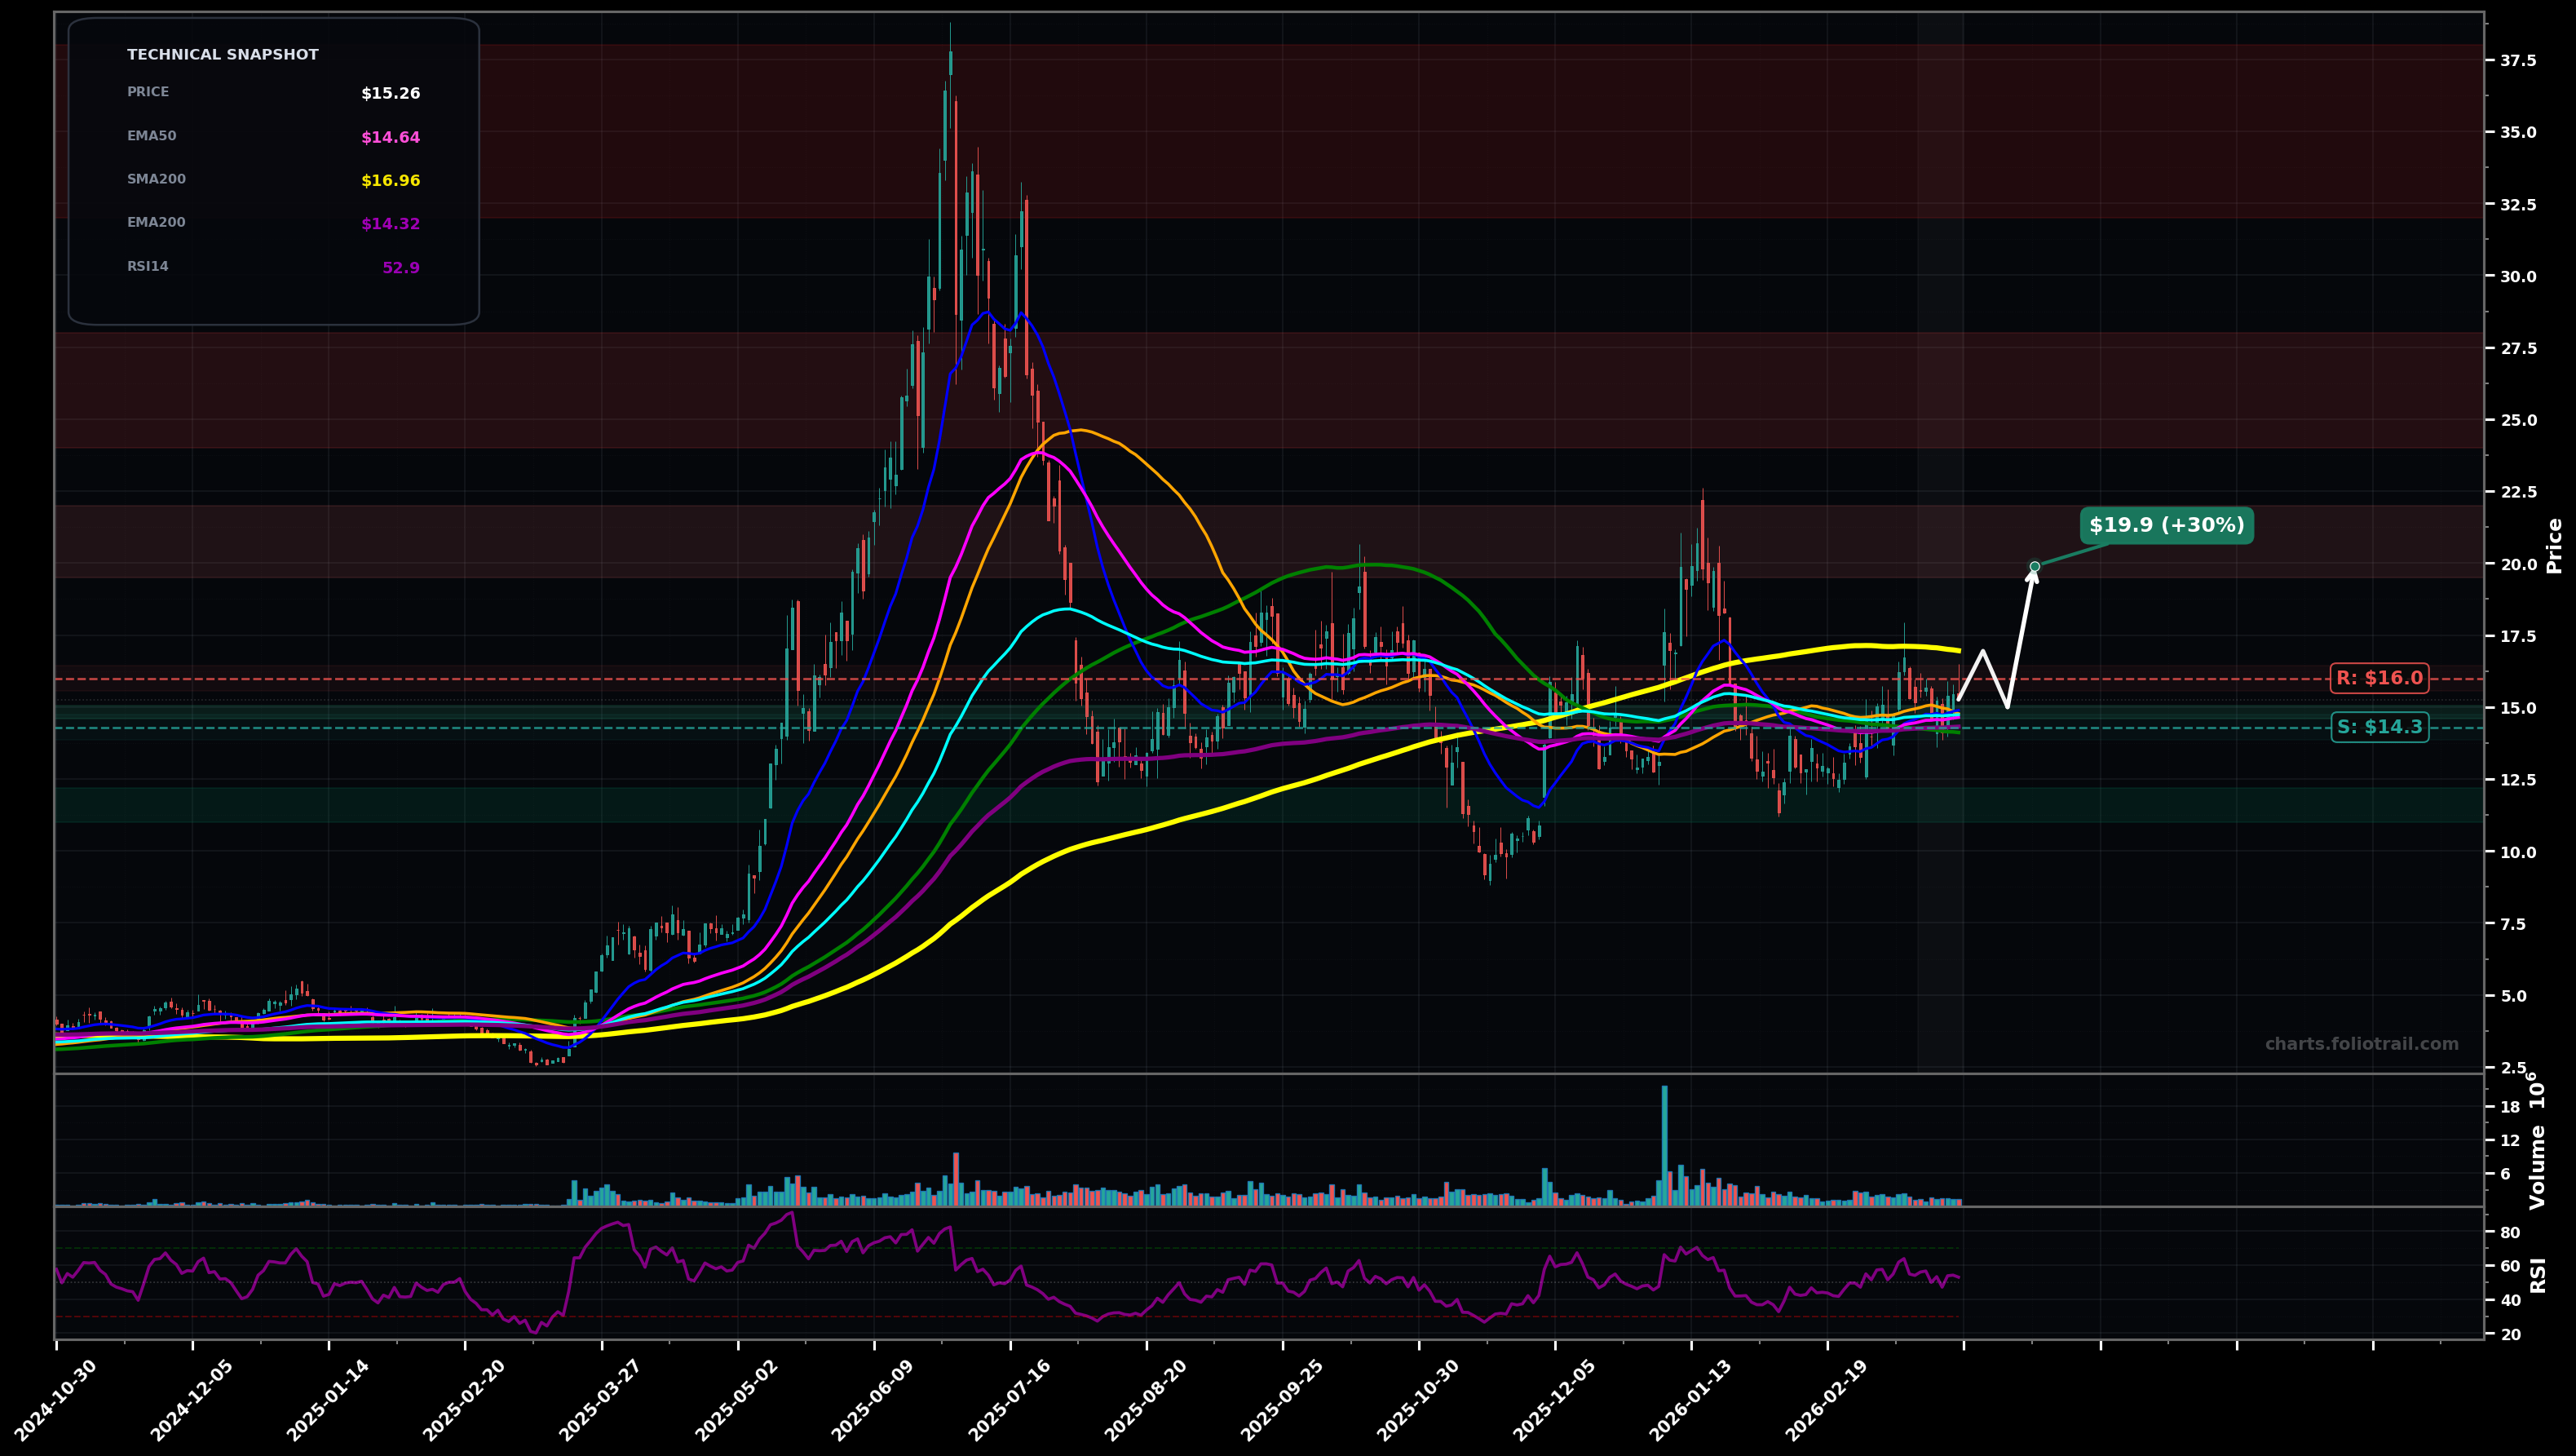
As of March 26, 2026, AEVA (Aeva Technologies, Inc.) is in a choppy range state on the daily chart, with a confidence level of 67%. Key support is at $14.3 and key resistance at $16.0. Price consolidating around clustered MAs near $15 after a prior spike-and-cooldown; last swings show range-bound action with mild upward bias into resistance.
Range resolves upward: reclaim $16.00 then attempt to clear the SMA200 zone; if accepted, continuation toward the prior supply area.
Range breaks down: lose $14.30 and drift to the prior swing-demand zone; possible undercut-and-rally attempt after a flush.
2+ daily closes above $16.00 with hold/retest acceptance (preferably reclaiming SMA200 ~$16.96)
Daily close below $14.30 (loss of EMA200 area) with follow-through
Start near MA-cluster/value area; add on support test at EMA200/swing-low zone; heavy add only on capitulation into deeper prior demand (better R:R).
Trim into Fibonacci/structure supply from prior distribution; larger trims into 2025 breakdown area; full exit into prior blow-off top region if revisited (high extension risk).
As of March 26, 2026, AEVA (Aeva Technologies, Inc.) is in a choppy range state on the daily chart with 67% confidence. Price consolidating around clustered MAs near $15 after a prior spike-and-cooldown; last swings show range-bound action with mild upward bias into resistance.
On the daily timeframe, AEVA has key support at $14.3 and key resistance at $16.0. The most likely scenario (bullish) targets $16.9 and $19.9, with a revert level at $15.0.
AEVA (Aeva Technologies, Inc.) is currently classified as choppy range on the daily chart, with 67% confidence. Confirmation requires: 2+ daily closes above $16.00 with hold/retest acceptance (preferably reclaiming SMA200 ~$16.96) This would be invalidated by: Daily close below $14.30 (loss of EMA200 area) with follow-through
The most likely scenario (bullish) targets $16.9 and $19.9, with a revert level at $15.0. The alternative scenario (bearish) targets $13.0 and $11.0.
Multi-layer AI agents analyse 200+ stocks across daily, weekly, and monthly timeframes — producing market state classifications, price scenarios with targets, and position entry/exit levels. Updated every trading day after market close. No paywall. No sign-up required.
Built by Foliotrail.
All content on this website — including charts, analysis, price targets, support/resistance levels, and position zones — is generated entirely by AI and provided for educational and informational purposes only.
This is not financial advice. NEXUSNOIR VENTURES SL (the operator of this website) is not a registered investment adviser or broker-dealer. You should not make investment decisions based solely on this information. Always do your own research and consult a qualified financial advisor.
By continuing, you acknowledge that you have read and agree to our full disclaimer & terms of use and privacy policy.