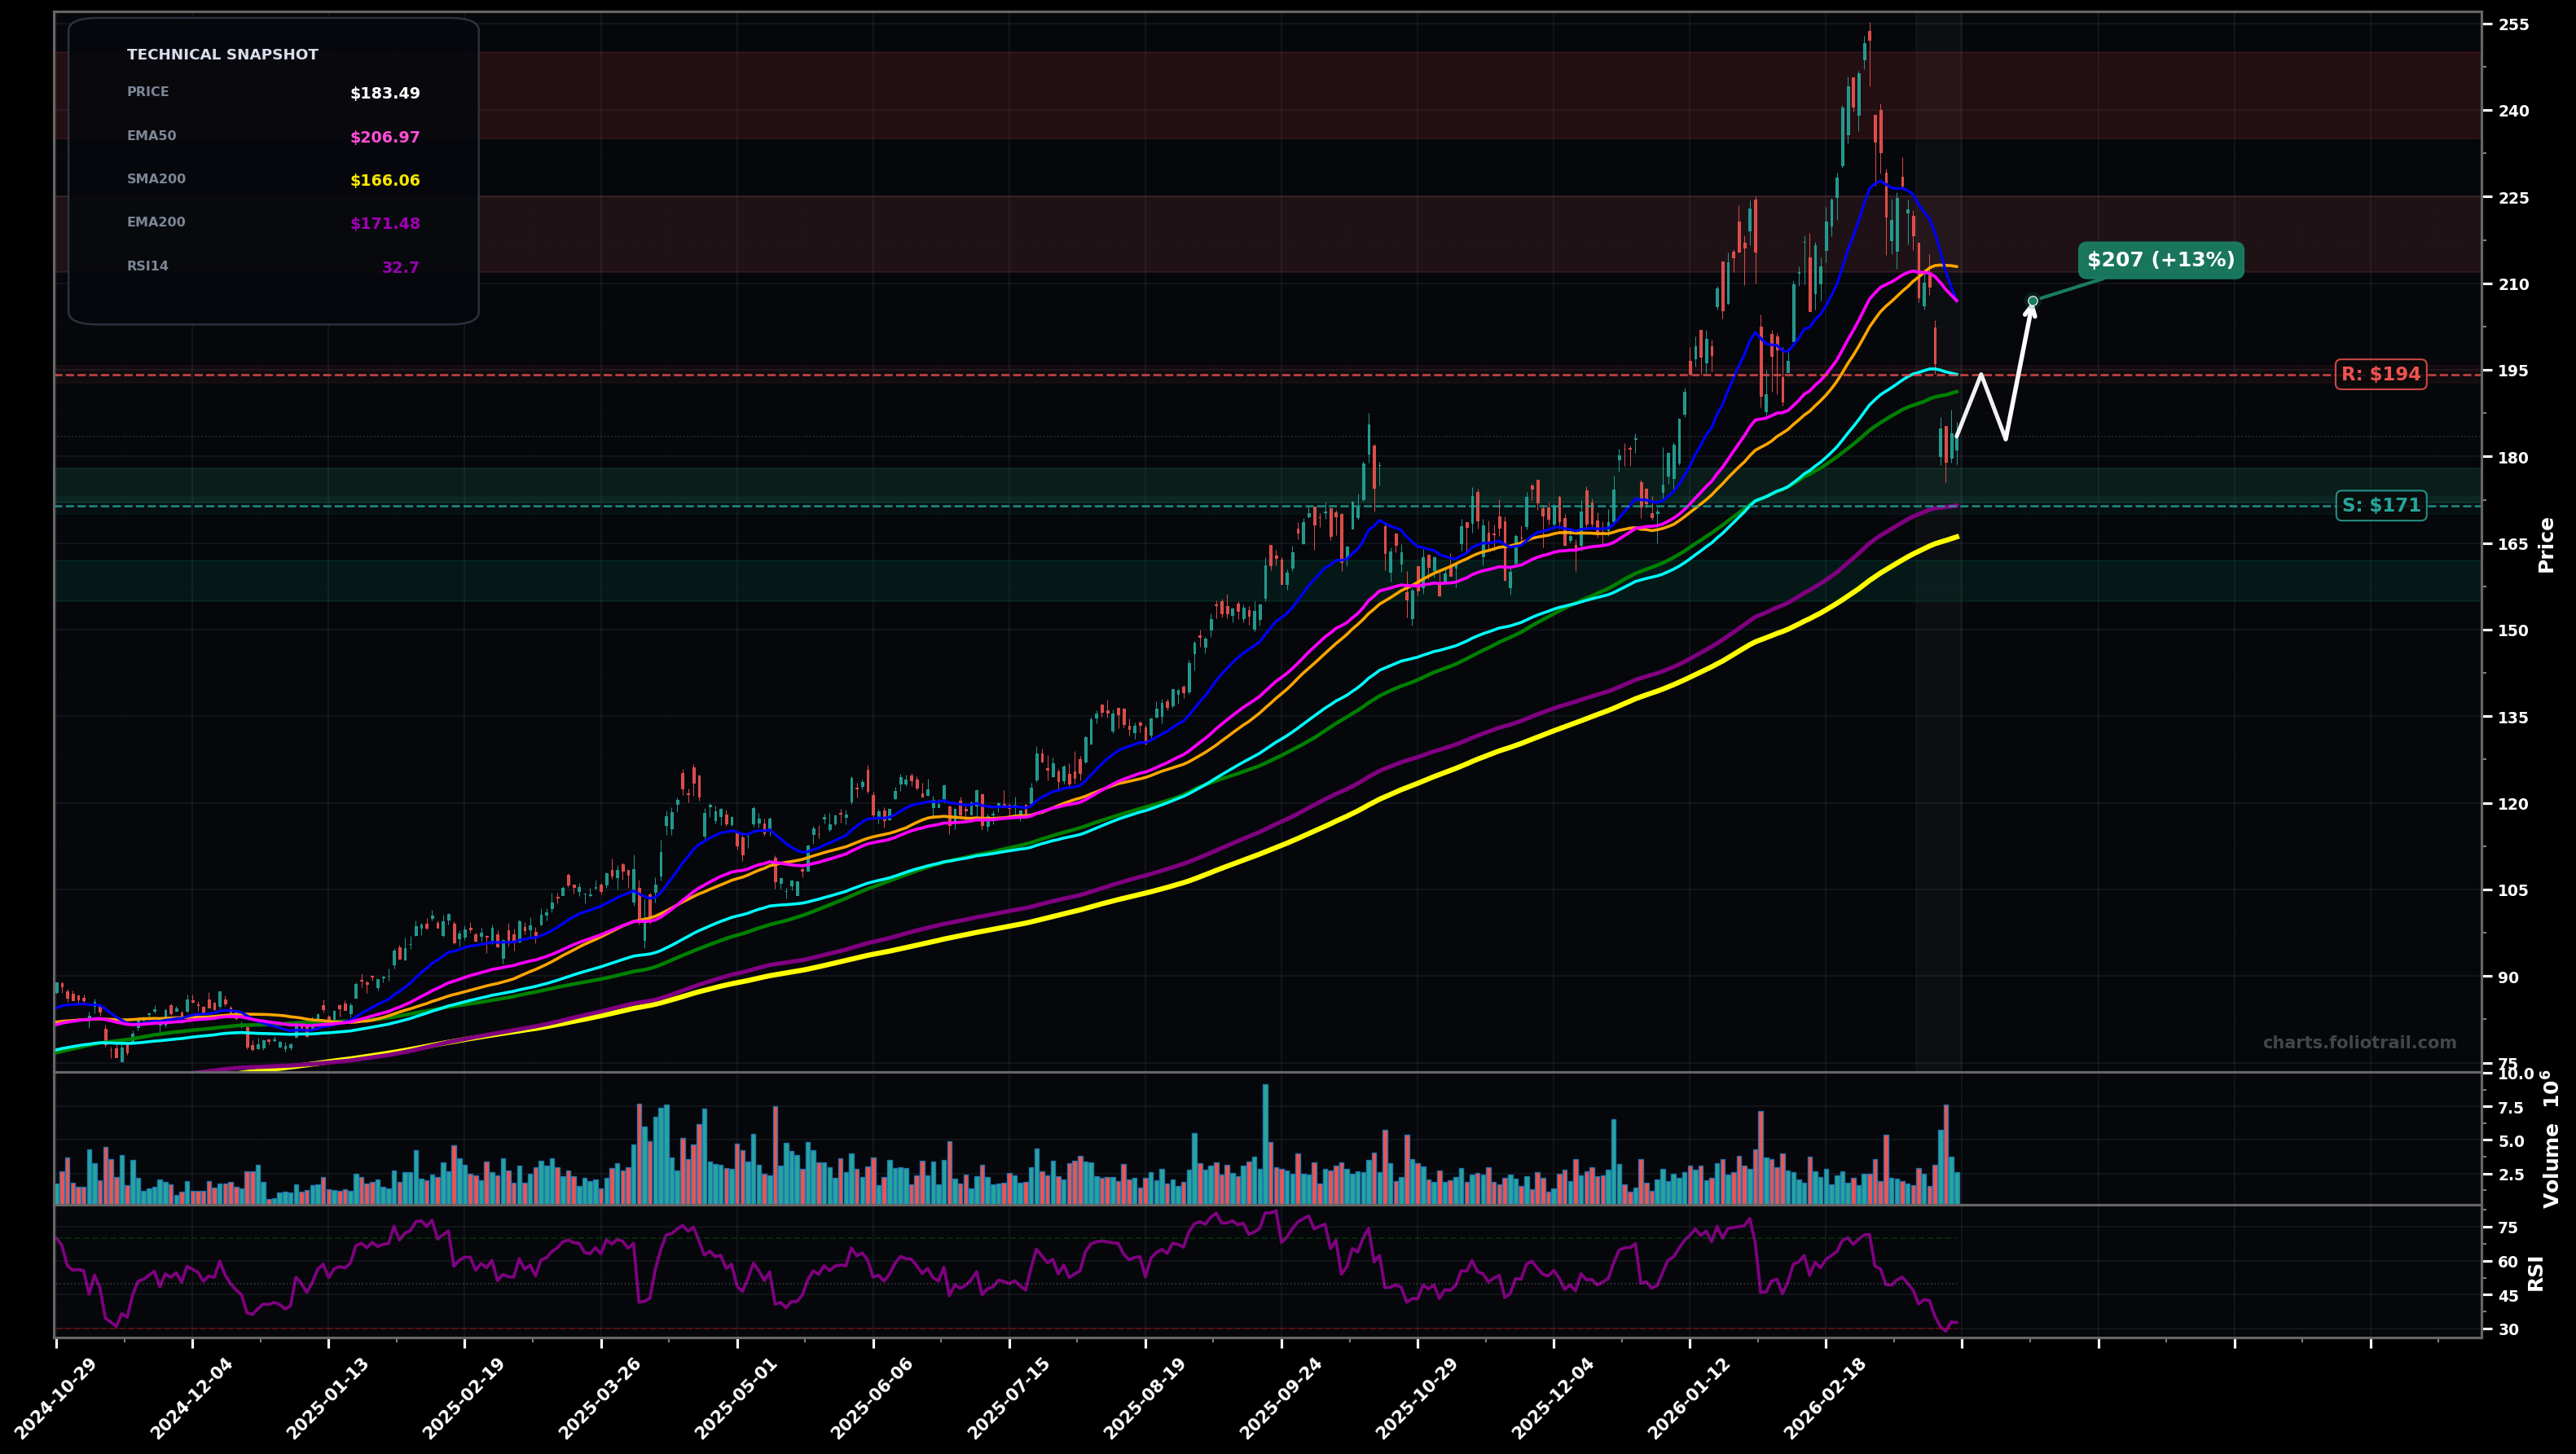
As of March 25, 2026, AEM (Agnico Eagle Mines Limited) is in a bottoming attempt state on the daily chart, with a confidence level of 58%. Key support is at $171 and key resistance at $194. Sharp pullback from ~$255 peak with price now ~$183.49; under EMA50/EMA100 and hovering just above SMA200/EMA200 zone; RSI ~32 (near oversold).
Base-building above the EMA200/SMA200 cluster, then a relief rally to reclaim EMA100 and retest the broken mid-band averages; likely Wave (4) style consolidation after a strong impulsive advance, with the selloff acting like an A-B-C correction from the ~$255 high.
Support fails and the correction extends lower (deeper Fibonacci retrace of the prior uptrend), with price losing the SMA200 and trending down toward the next demand band before any durable reversal.
2+ daily closes back above the EMA100 (~$194.22) with follow-through toward ~$206
Daily close below $166 (loss of SMA200 support) with continuation
Scale near the EMA200/SMA200 support cluster first; add on confirmed holds/undercuts of $166-$172; heavy add only if a capitulation wick/reversal forms into the next lower demand band.
Trim into reclaim of SMA50/SMA100 overhead supply; derisk more as price approaches prior distribution area; close/major trim near the prior ATH zone where rejection previously started.
As of March 25, 2026, AEM (Agnico Eagle Mines Limited) is in a bottoming attempt state on the daily chart with 58% confidence. Sharp pullback from ~$255 peak with price now ~$183.49; under EMA50/EMA100 and hovering just above SMA200/EMA200 zone; RSI ~32 (near oversold).
On the daily timeframe, AEM has key support at $171 and key resistance at $194. The most likely scenario (bullish) targets $194 and $207, with a revert level at $183.
AEM (Agnico Eagle Mines Limited) is currently classified as bottoming attempt on the daily chart, with 58% confidence. Confirmation requires: 2+ daily closes back above the EMA100 (~$194.22) with follow-through toward ~$206 This would be invalidated by: Daily close below $166 (loss of SMA200 support) with continuation
The most likely scenario (bullish) targets $194 and $207, with a revert level at $183. The alternative scenario (bearish) targets $171 and $166.
Multi-layer AI agents analyse 200+ stocks across daily, weekly, and monthly timeframes — producing market state classifications, price scenarios with targets, and position entry/exit levels. Updated every trading day after market close. No paywall. No sign-up required.
Built by Foliotrail.
All content on this website — including charts, analysis, price targets, support/resistance levels, and position zones — is generated entirely by AI and provided for educational and informational purposes only.
This is not financial advice. NEXUSNOIR VENTURES SL (the operator of this website) is not a registered investment adviser or broker-dealer. You should not make investment decisions based solely on this information. Always do your own research and consult a qualified financial advisor.
By continuing, you acknowledge that you have read and agree to our full disclaimer & terms of use and privacy policy.