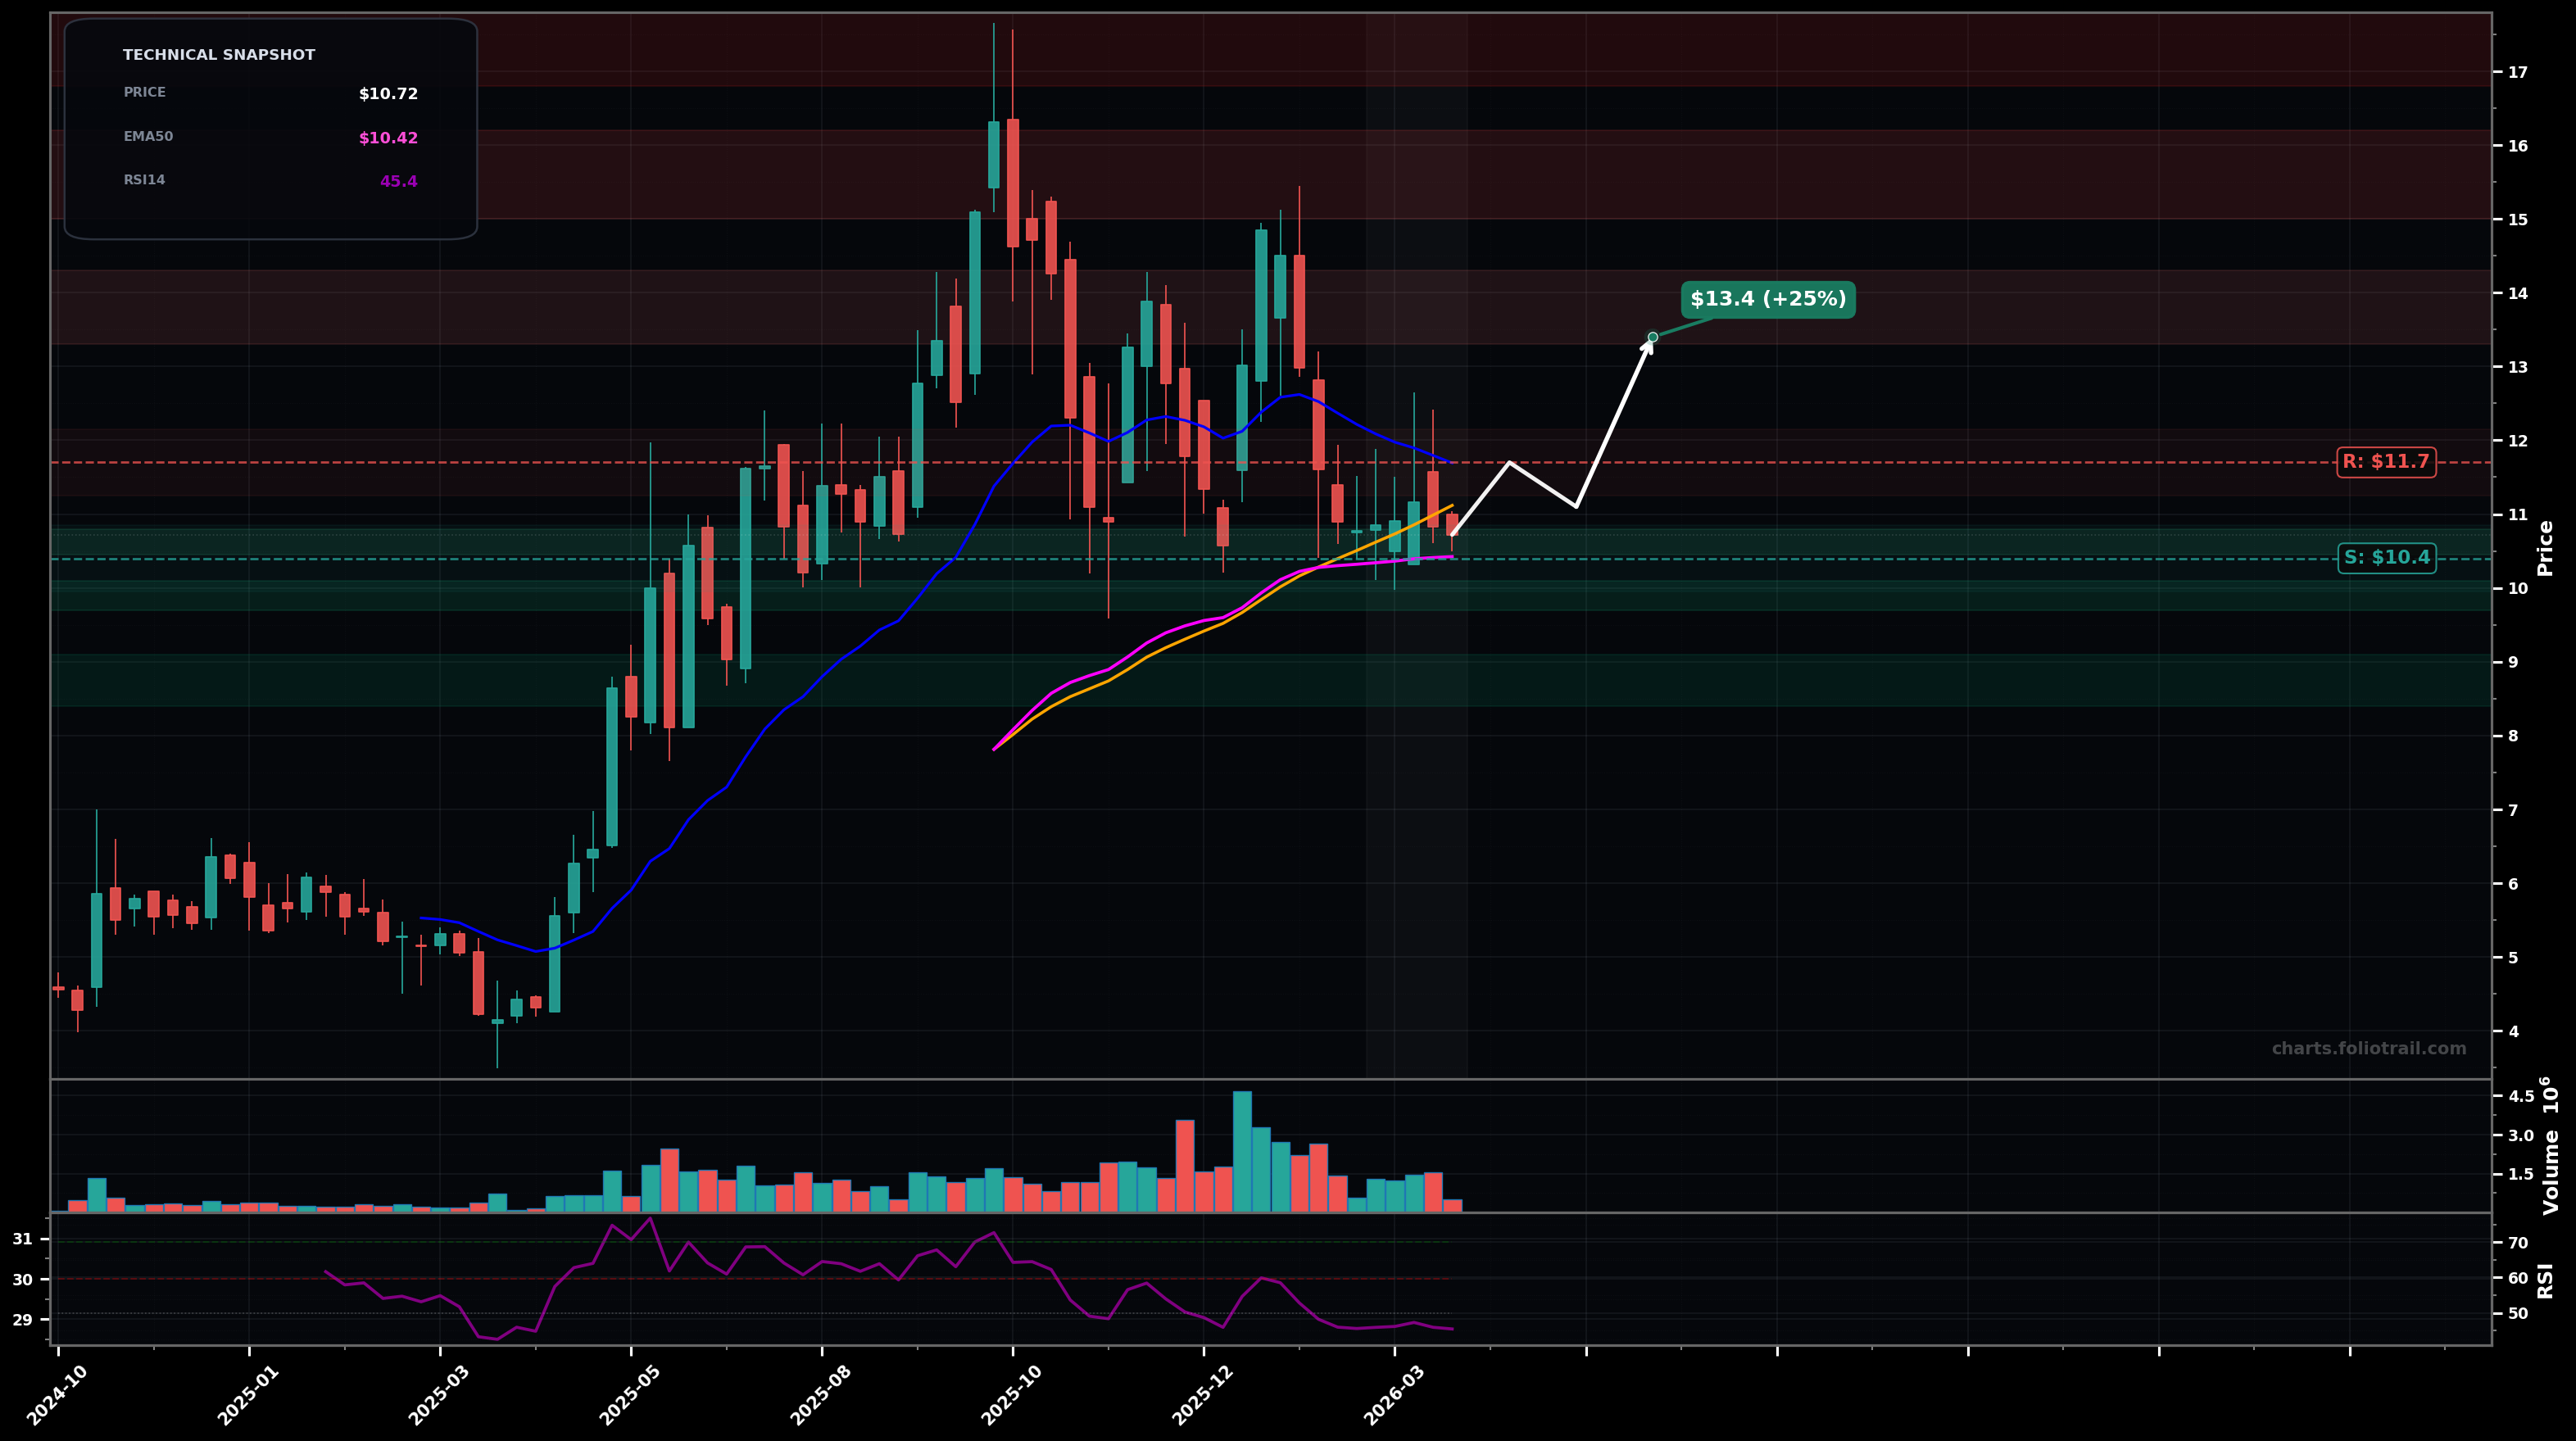
As of March 25, 2026, ADUR (Aduro Clean Technologies Inc.) is in a choppy range state on the weekly chart, with a confidence level of 63%. Key support is at $10.4 and key resistance at $11.7. Weekly price at ~$10.72 drifting sideways-to-down after a failed bounce; candles compressing just above the rising EMA50 (~$10.42) while remaining below the faster MA cluster (SMA50/EMA20).
Range continuation with mild bullish resolution: hold $10.40 support, grind back above $11.1–$11.7, then attempt a breakout toward prior supply.
Bearish break of the range: lose $10.40, trigger stops, and mean-revert toward the prior weekly pivot zone before any durable base forms.
2+ weekly closes above $11.70 (reclaim and hold above EMA20/SMA50 zone) would confirm a breakout-reversal attempt
Weekly close below $10.40 (loss of EMA50 + range floor) would invalidate the range/basing view and tilt bearish
Start near EMA50/range support ($10.4) with tight invalidation; add on breakdown-to-support retest near prior pivots; heavy add only at deeper Fib-style retrace/old consolidation where risk:reward improves.
Trim into overhead supply from prior distribution/peaks; heavier trims as price revisits the prior spike zone; close into extreme retest of the blow-off high area where multi-year forward returns typically compress.
As of March 25, 2026, ADUR (Aduro Clean Technologies Inc.) is in a choppy range state on the weekly chart with 63% confidence. Weekly price at ~$10.72 drifting sideways-to-down after a failed bounce; candles compressing just above the rising EMA50 (~$10.42) while remaining below the faster MA cluster (SMA50/EMA20).
On the weekly timeframe, ADUR has key support at $10.4 and key resistance at $11.7. The most likely scenario (bullish) targets $11.7 and $13.4, with a revert level at $11.1.
ADUR (Aduro Clean Technologies Inc.) is currently classified as choppy range on the weekly chart, with 63% confidence. Confirmation requires: 2+ weekly closes above $11.70 (reclaim and hold above EMA20/SMA50 zone) would confirm a breakout-reversal attempt This would be invalidated by: Weekly close below $10.40 (loss of EMA50 + range floor) would invalidate the range/basing view and tilt bearish
The most likely scenario (bullish) targets $11.7 and $13.4, with a revert level at $11.1. The alternative scenario (bearish) targets $9.60 and $8.40.
Multi-layer AI agents analyse 200+ stocks across daily, weekly, and monthly timeframes — producing market state classifications, price scenarios with targets, and position entry/exit levels. Updated every trading day after market close. No paywall. No sign-up required.
Built by Foliotrail.
All content on this website — including charts, analysis, price targets, support/resistance levels, and position zones — is generated entirely by AI and provided for educational and informational purposes only.
This is not financial advice. NEXUSNOIR VENTURES SL (the operator of this website) is not a registered investment adviser or broker-dealer. You should not make investment decisions based solely on this information. Always do your own research and consult a qualified financial advisor.
By continuing, you acknowledge that you have read and agree to our full disclaimer & terms of use and privacy policy.