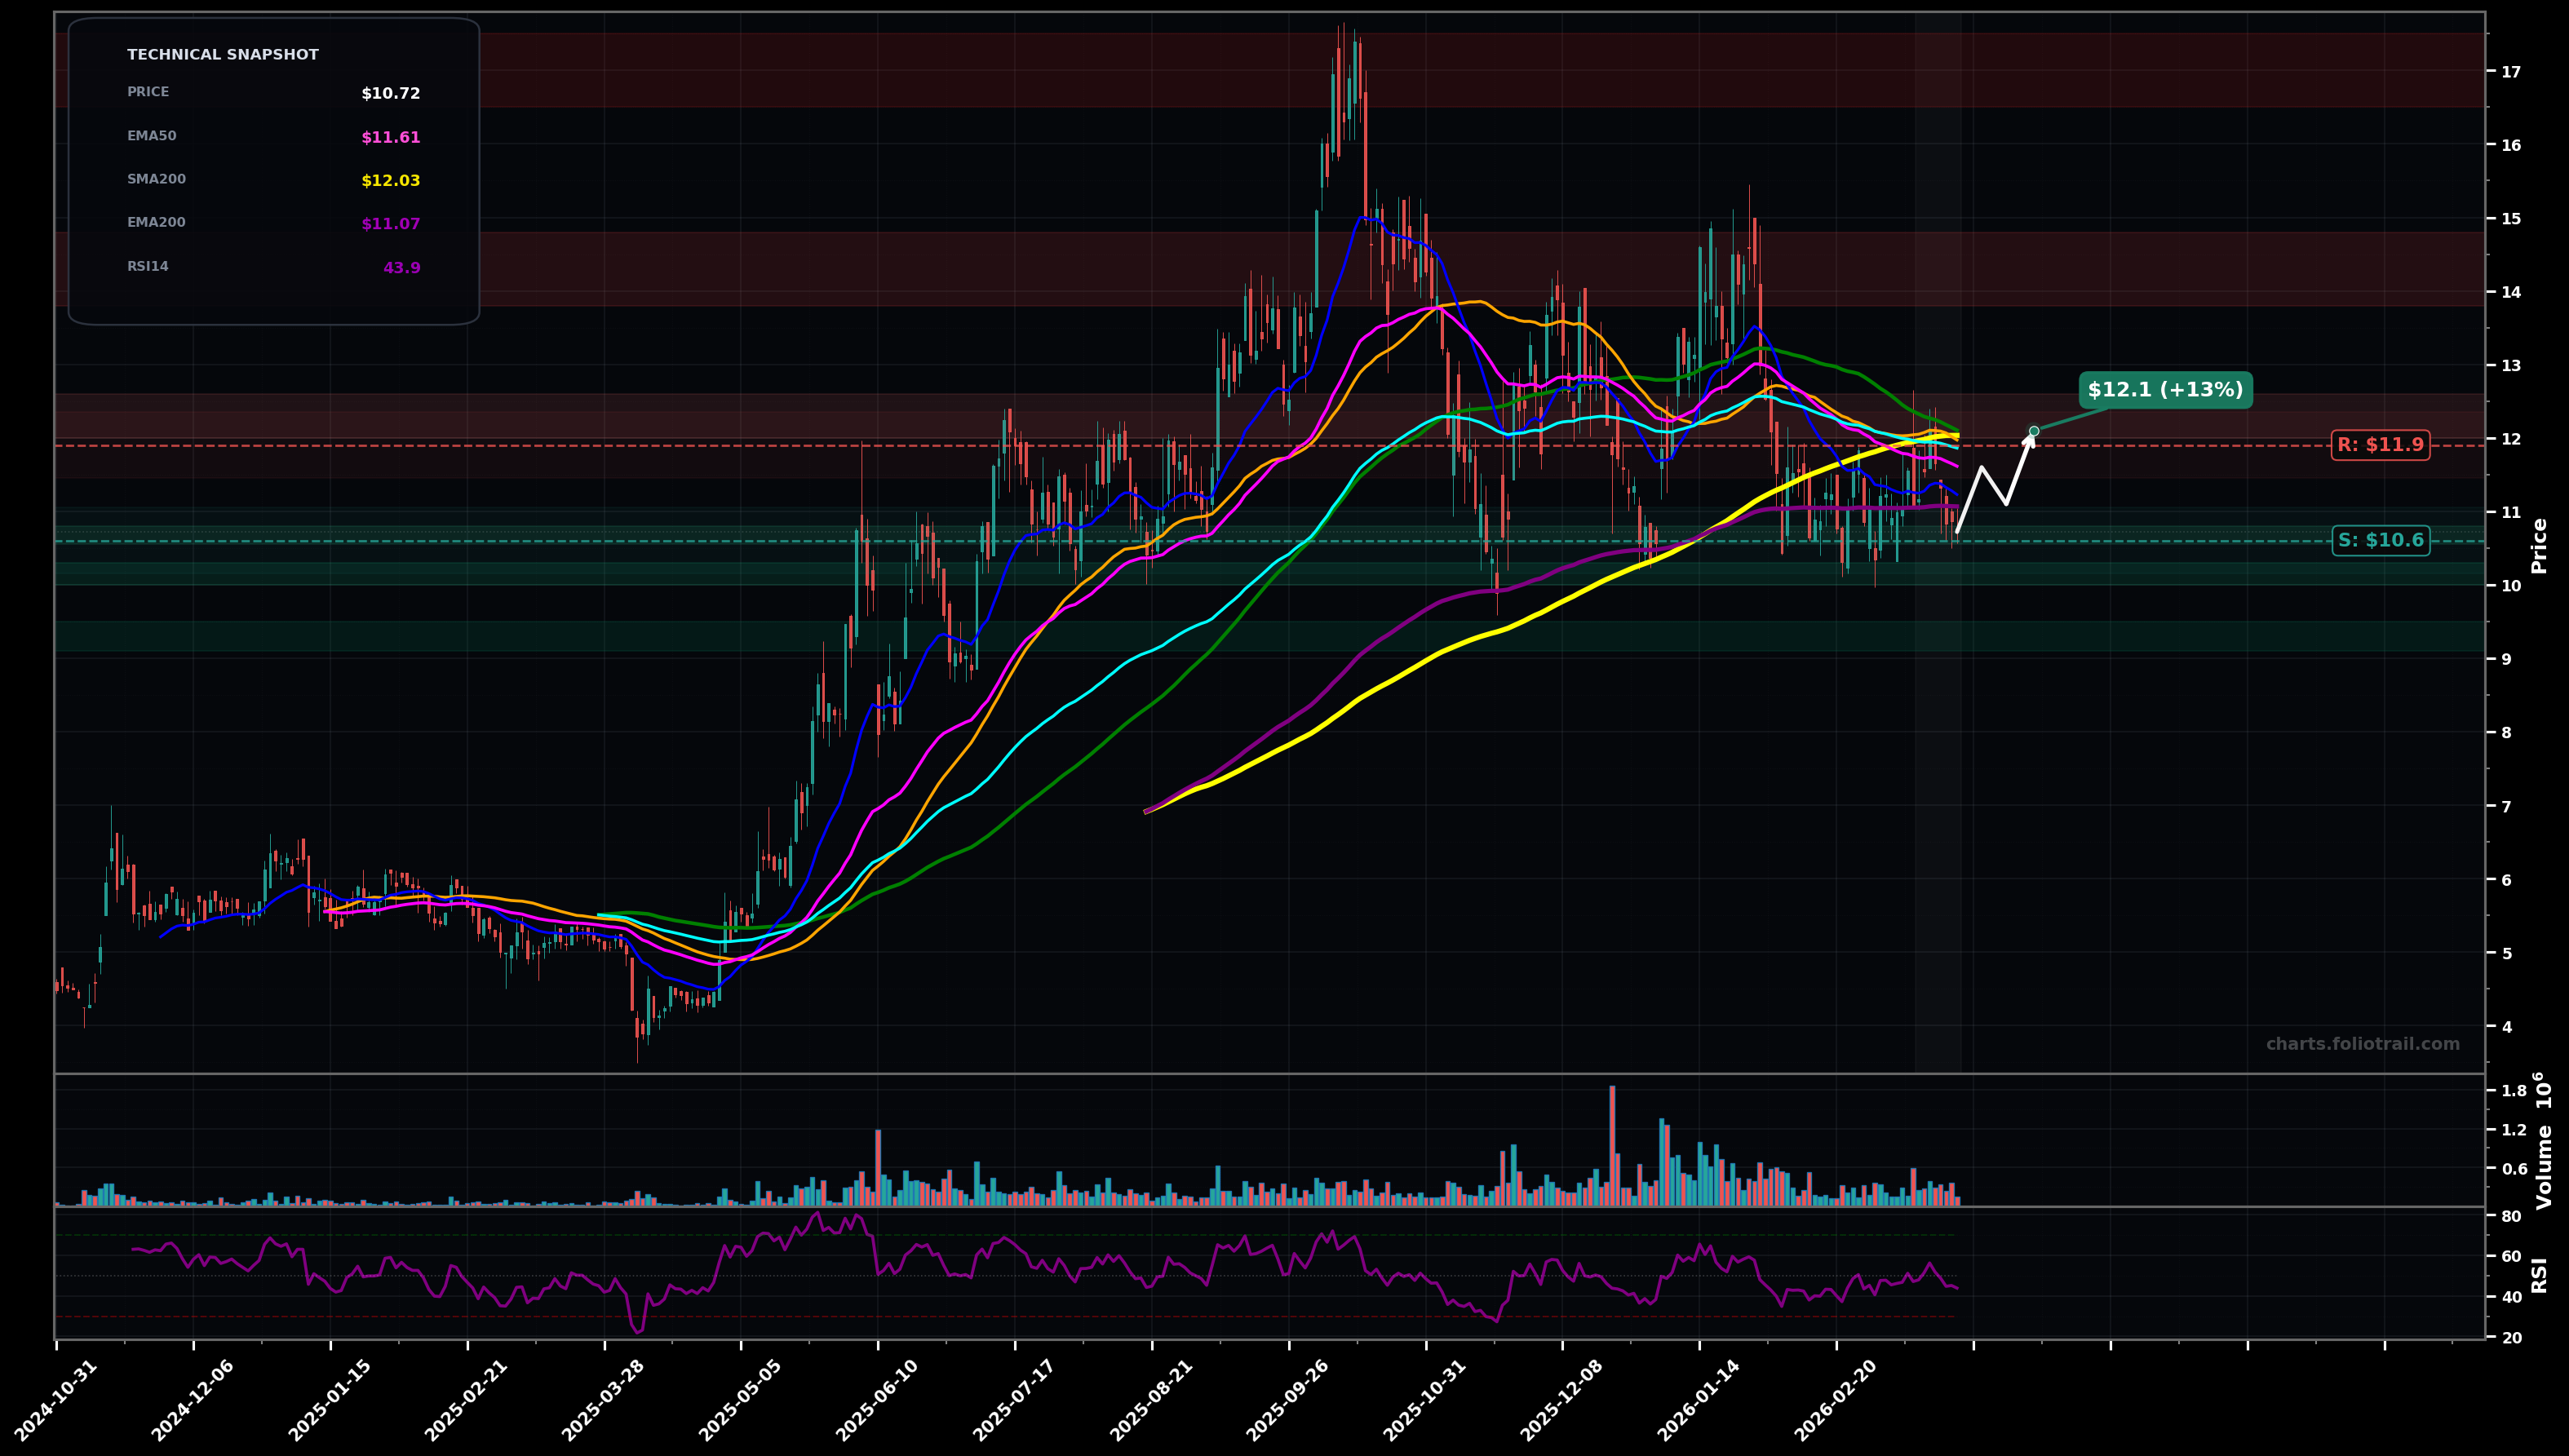
As of March 25, 2026, ADUR (Aduro Clean Technologies Inc.) is in a choppy range state on the daily chart, with a confidence level of 64%. Key support is at $10.6 and key resistance at $11.9. Price at $10.72 is grinding lower in a sideways-to-down range, holding just above the rising long-term SMA200 ($12.03) breakdown zone and above EMA200 ($11.07), while staying below EMA50/EMA100 (~$11.61/$11.86).
Base continues: price holds $10.60-$10.50 support, mean-reverts back toward the moving-average cluster; potential Elliott view is a corrective ABC/complex correction still in progress with a rebound leg toward the B-wave/previous pivot zone.
Support fails: clean breakdown under the $10.60-$10.50 swing-low reference triggers continuation lower; Elliott view shifts to a larger degree wave (C) or wave 3 down extending below the prior consolidation shelf.
2+ daily closes above $11.90 (reclaim EMA100 + prior supply) would confirm a BREAKOUT_REVERSAL attempt
Daily close below $10.50 (range floor break) would invalidate the range thesis and tilt to DOWNTREND
Start near range support; add on breakdown-to-support shelf ($10s) if sellers stall; heavy add only near next demand pocket/extension if capitulation-like flush occurs.
Trim into prior MA/structure resistance ($12s) then larger supply zones from the post-peak distribution ($14s), and fully close into the former blow-off top area ($17s) if revisited.
As of March 25, 2026, ADUR (Aduro Clean Technologies Inc.) is in a choppy range state on the daily chart with 64% confidence. Price at $10.72 is grinding lower in a sideways-to-down range, holding just above the rising long-term SMA200 ($12.03) breakdown zone and above EMA200 ($11.07), while staying below EMA50/EMA100 (~$11.61/$11.86).
On the daily timeframe, ADUR has key support at $10.6 and key resistance at $11.9. The most likely scenario (bullish) targets $11.6 and $12.1, with a revert level at $11.1.
ADUR (Aduro Clean Technologies Inc.) is currently classified as choppy range on the daily chart, with 64% confidence. Confirmation requires: 2+ daily closes above $11.90 (reclaim EMA100 + prior supply) would confirm a BREAKOUT_REVERSAL attempt This would be invalidated by: Daily close below $10.50 (range floor break) would invalidate the range thesis and tilt to DOWNTREND
The most likely scenario (bullish) targets $11.6 and $12.1, with a revert level at $11.1. The alternative scenario (bearish) targets $10.0 and $9.20.
Multi-layer AI agents analyse 200+ stocks across daily, weekly, and monthly timeframes — producing market state classifications, price scenarios with targets, and position entry/exit levels. Updated every trading day after market close. No paywall. No sign-up required.
Built by Foliotrail.
All content on this website — including charts, analysis, price targets, support/resistance levels, and position zones — is generated entirely by AI and provided for educational and informational purposes only.
This is not financial advice. NEXUSNOIR VENTURES SL (the operator of this website) is not a registered investment adviser or broker-dealer. You should not make investment decisions based solely on this information. Always do your own research and consult a qualified financial advisor.
By continuing, you acknowledge that you have read and agree to our full disclaimer & terms of use and privacy policy.