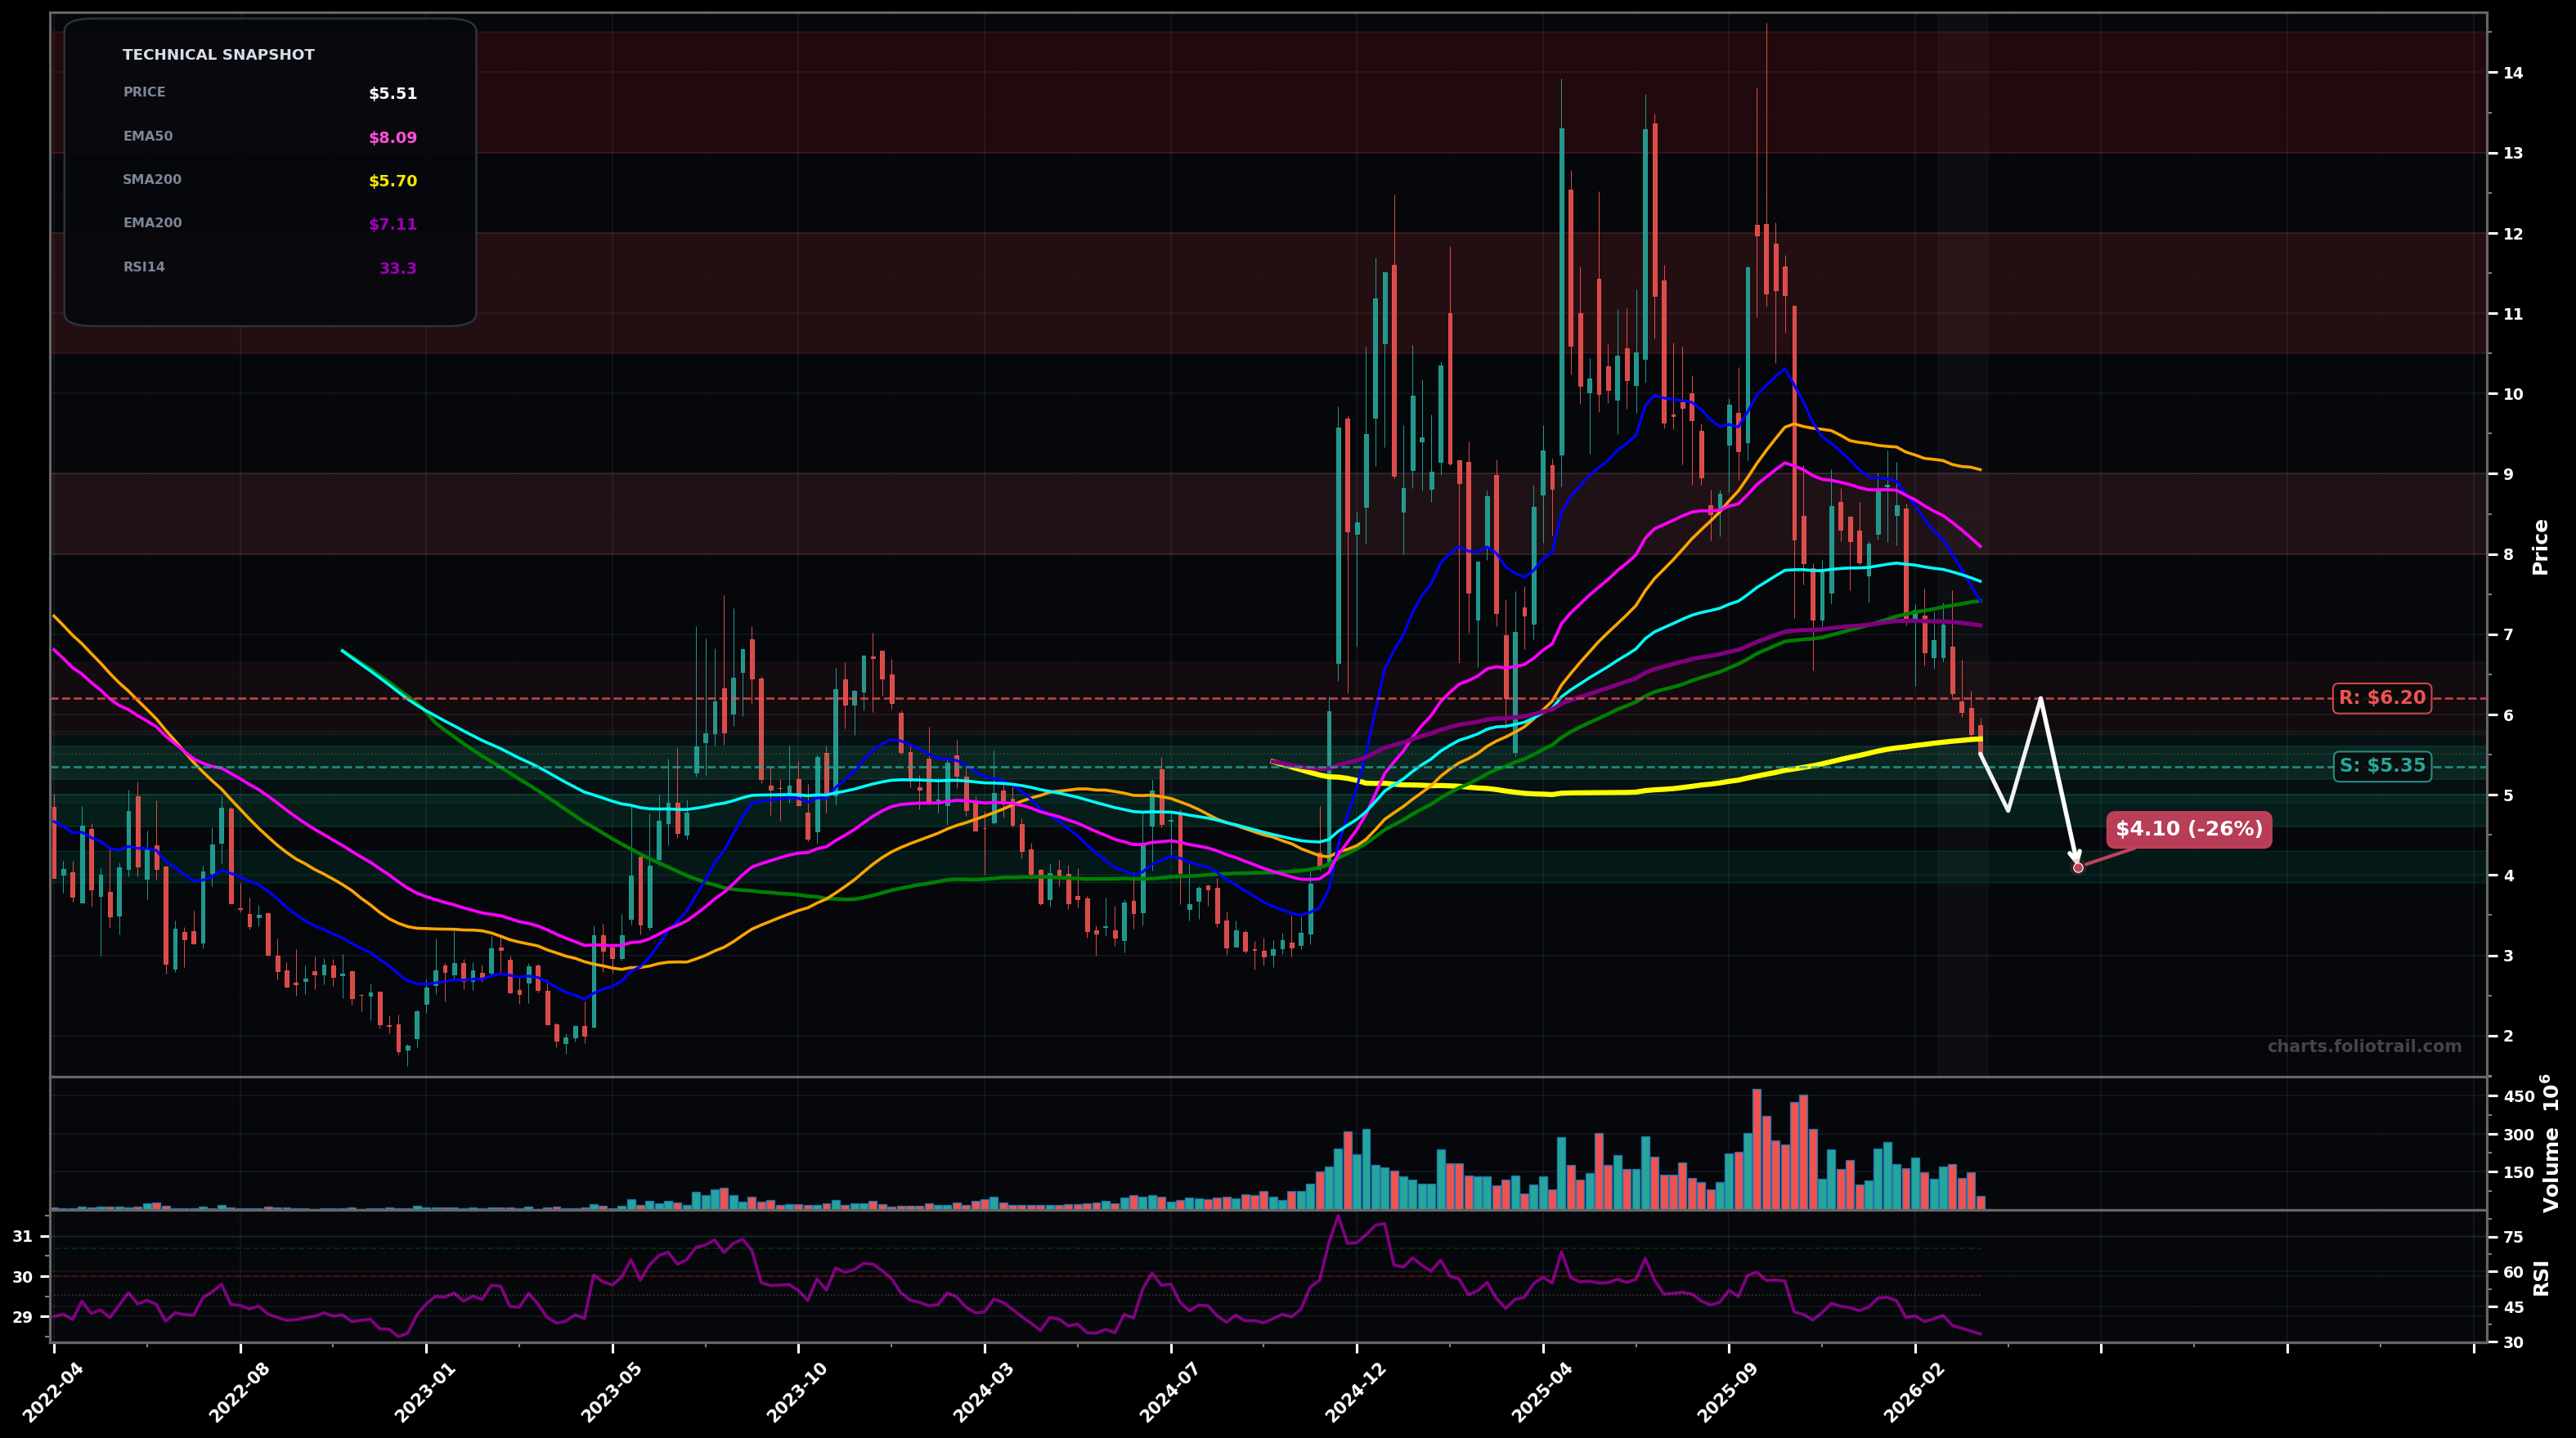
As of March 25, 2026, ACHR (Archer Aviation Inc.) is in a downtrend state on the weekly chart, with a confidence level of 72%. Key support is at $5.35 and key resistance at $6.20. Weekly downtrend continuation; price ($5.51) rejected below clustered mid-MAs and is sitting just under SMA200 (~$5.70) with weak momentum (RSI ~33).
Bearish continuation: lose the SMA200 zone and drift/flush toward the next demand band; wave read fits an Elliott ABC down from the ~$12-$14 top with C still pressuring lower until capitulation/RSI divergence appears.
Relief bounce / bottoming attempt: hold $5.35-$5.70 and form a weekly higher low, then mean-revert toward the EMA200/EMA100 cluster; likely as a corrective (wave 2/4) bounce unless it reclaims multiple MAs with follow-through.
Weekly close below $5.35 (SMA200 loss + new swing-low break) would confirm continued DOWNTREND pressure
Weekly close back above $7.10 (reclaim EMA200 area and prior breakdown zone) would invalidate the immediate downtrend pressure
Start near SMA200/support ($5.35-$5.70) for a potential hold; add on breakdown into prior consolidation demand (~$4.6-$5.0); heavy add near deeper support/likely Fib extension area (~$3.9-$4.3) if capitulation occurs.
Trim into first mean-reversion to EMA50/SMA50 region (~$8-$9), trim more into prior distribution supply (~$10.5-$12), and consider full exit near the prior blow-off/major resistance zone (~$13-$14.5).
As of March 25, 2026, ACHR (Archer Aviation Inc.) is in a downtrend state on the weekly chart with 72% confidence. Weekly downtrend continuation; price ($5.51) rejected below clustered mid-MAs and is sitting just under SMA200 (~$5.70) with weak momentum (RSI ~33).
On the weekly timeframe, ACHR has key support at $5.35 and key resistance at $6.20. The most likely scenario (bearish) targets $4.80 and $4.10, with a revert level at $6.20.
ACHR (Archer Aviation Inc.) is currently classified as downtrend on the weekly chart, with 72% confidence. Confirmation requires: Weekly close below $5.35 (SMA200 loss + new swing-low break) would confirm continued DOWNTREND pressure This would be invalidated by: Weekly close back above $7.10 (reclaim EMA200 area and prior breakdown zone) would invalidate the immediate downtrend pressure
The most likely scenario (bearish) targets $4.80 and $4.10, with a revert level at $6.20. The alternative scenario (bullish) targets $7.10 and $8.10.
Multi-layer AI agents analyse 200+ stocks across daily, weekly, and monthly timeframes — producing market state classifications, price scenarios with targets, and position entry/exit levels. Updated every trading day after market close. No paywall. No sign-up required.
Built by Foliotrail.
All content on this website — including charts, analysis, price targets, support/resistance levels, and position zones — is generated entirely by AI and provided for educational and informational purposes only.
This is not financial advice. NEXUSNOIR VENTURES SL (the operator of this website) is not a registered investment adviser or broker-dealer. You should not make investment decisions based solely on this information. Always do your own research and consult a qualified financial advisor.
By continuing, you acknowledge that you have read and agree to our full disclaimer & terms of use and privacy policy.