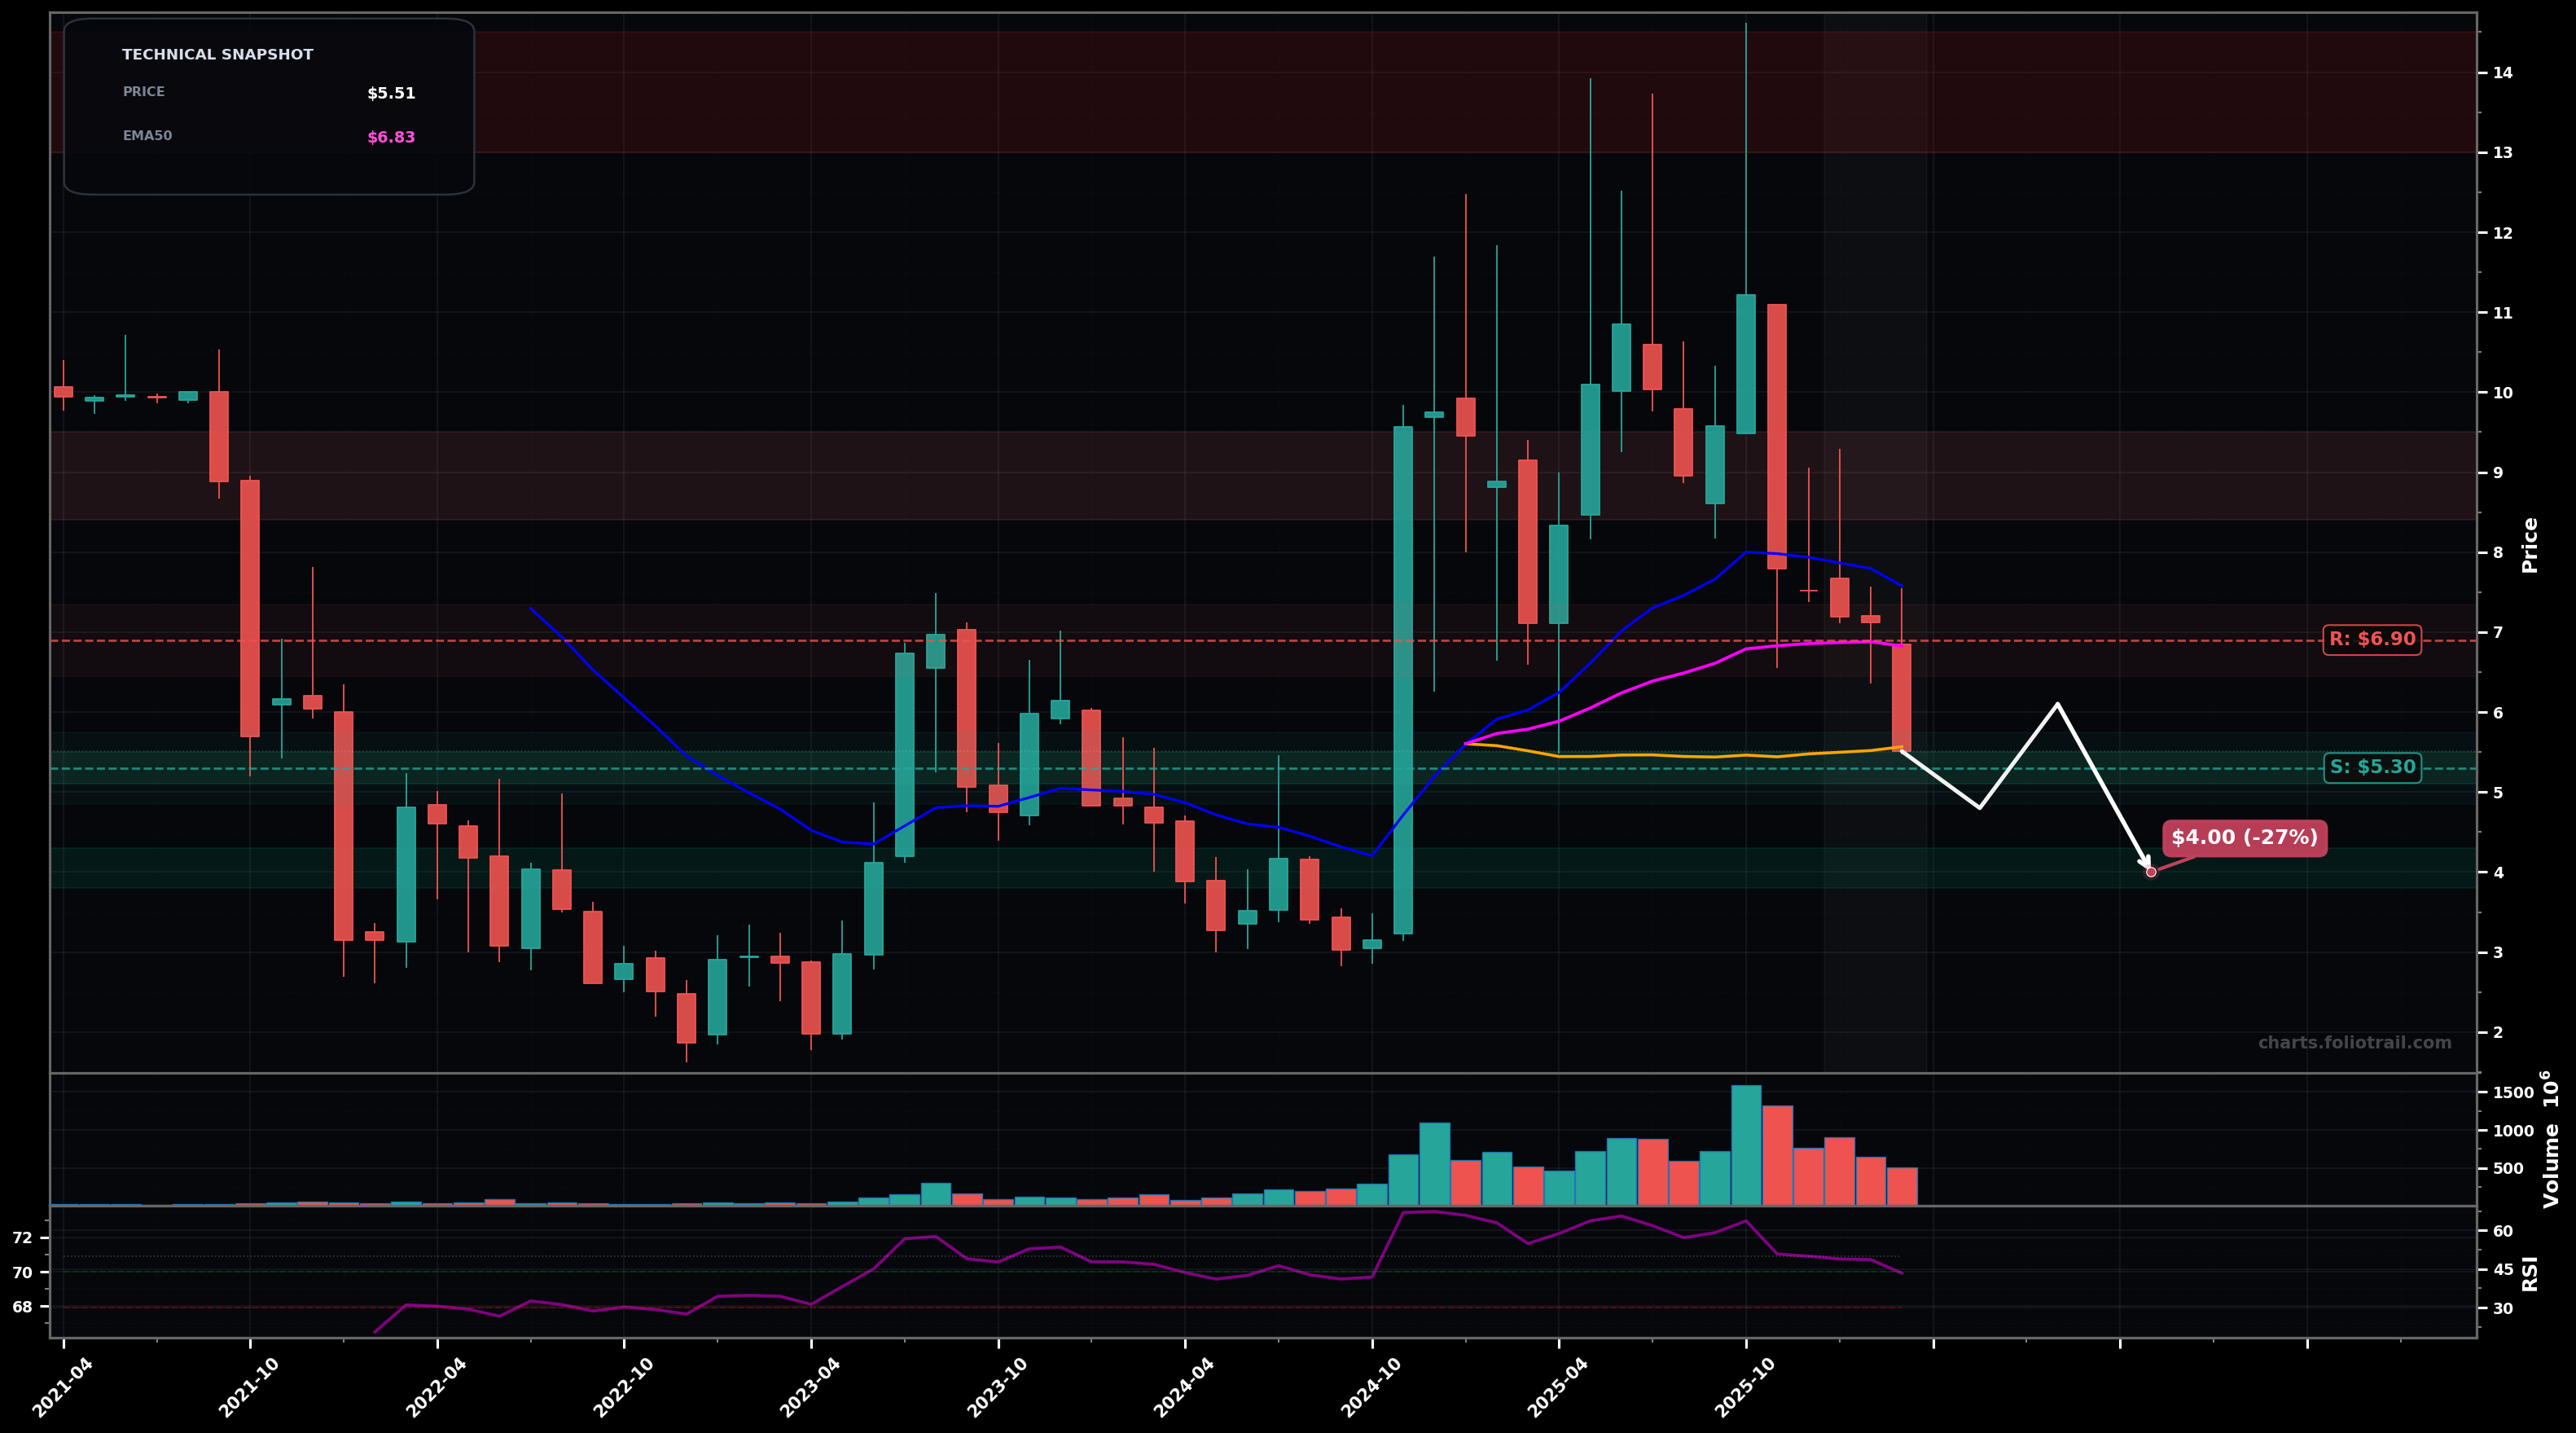
As of March 25, 2026, ACHR (Archer Aviation Inc.) is in a downtrend state on the monthly chart, with a confidence level of 66%. Key support is at $5.30 and key resistance at $6.90. Monthly pullback after a sharp run-up; price $5.51 is below SMA50 ($5.57) and well below EMA20 ($7.58) / EMA50 ($6.83) with RSI14 ~43 (weak momentum).
Bearish continuation / deeper Wave (C) or Wave 2 pullback: price loses the $5.30 swing-low area and drifts toward prior base support; sellers likely defend EMA50 on any bounce.
Bottoming attempt: price holds $5.30, forms a higher low, then reclaims EMA50; this would fit an Elliott Wave view of a corrective leg ending (Wave 2 or Wave (4)) and starting a new impulse attempt.
Monthly close below $5.30 (break of the recent swing-low area) would confirm continued downtrend pressure.
2+ monthly closes back above $6.90 (reclaim/hold above EMA50 zone) would invalidate the downtrend label.
Start near current support ($5.30 area); add on a flush toward the prior consolidation; heavy add only at deeper Fib-style retrace/base support where risk/reward improves.
Trim into prior supply from the post-spike distribution zone (likely Fib retrace/overhead resistance); close into the former blow-off highs where long-term forward returns are typically most stretched.
As of March 25, 2026, ACHR (Archer Aviation Inc.) is in a downtrend state on the monthly chart with 66% confidence. Monthly pullback after a sharp run-up; price $5.51 is below SMA50 ($5.57) and well below EMA20 ($7.58) / EMA50 ($6.83) with RSI14 ~43 (weak momentum).
On the monthly timeframe, ACHR has key support at $5.30 and key resistance at $6.90. The most likely scenario (bearish) targets $4.80 and $4.00, with a revert level at $6.10.
ACHR (Archer Aviation Inc.) is currently classified as downtrend on the monthly chart, with 66% confidence. Confirmation requires: Monthly close below $5.30 (break of the recent swing-low area) would confirm continued downtrend pressure. This would be invalidated by: 2+ monthly closes back above $6.90 (reclaim/hold above EMA50 zone) would invalidate the downtrend label.
The most likely scenario (bearish) targets $4.80 and $4.00, with a revert level at $6.10. The alternative scenario (bullish) targets $6.90 and $8.50.
Multi-layer AI agents analyse 200+ stocks across daily, weekly, and monthly timeframes — producing market state classifications, price scenarios with targets, and position entry/exit levels. Updated every trading day after market close. No paywall. No sign-up required.
Built by Foliotrail.
All content on this website — including charts, analysis, price targets, support/resistance levels, and position zones — is generated entirely by AI and provided for educational and informational purposes only.
This is not financial advice. NEXUSNOIR VENTURES SL (the operator of this website) is not a registered investment adviser or broker-dealer. You should not make investment decisions based solely on this information. Always do your own research and consult a qualified financial advisor.
By continuing, you acknowledge that you have read and agree to our full disclaimer & terms of use and privacy policy.