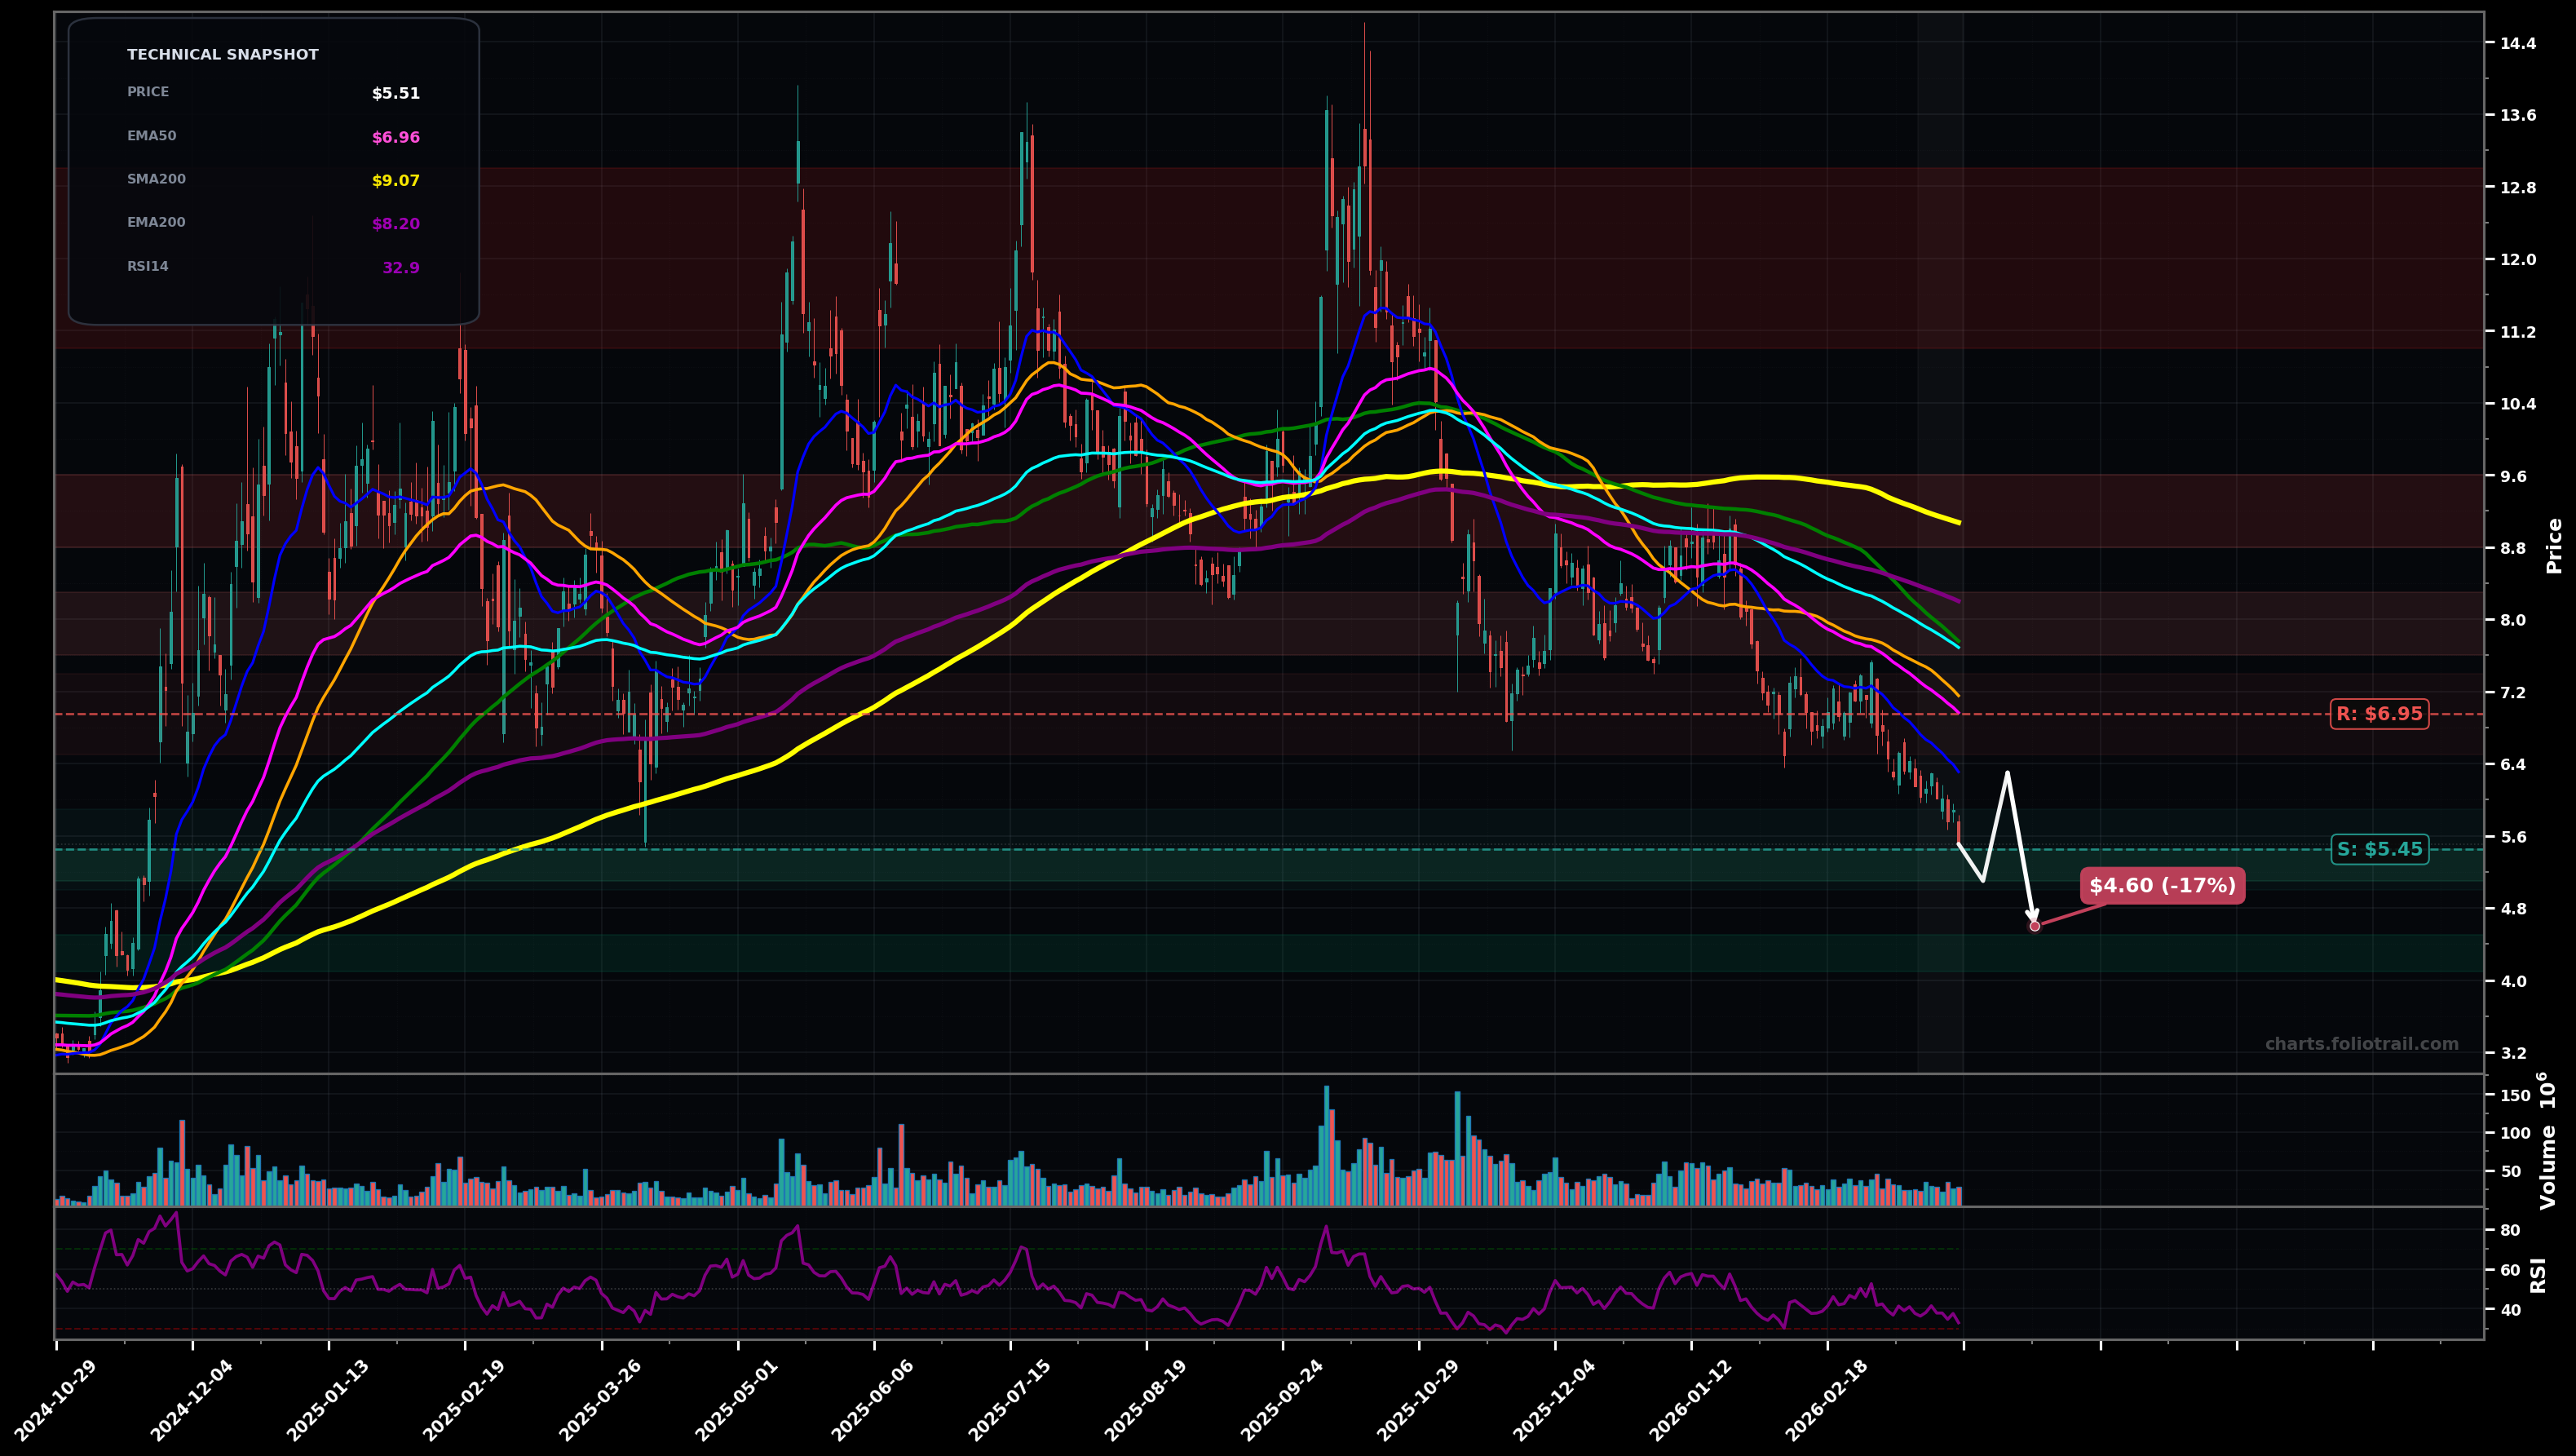
As of March 25, 2026, ACHR (Archer Aviation Inc.) is in a falling knife state on the daily chart, with a confidence level of 74%. Key support is at $5.45 and key resistance at $6.95. Continued selloff with price at ~$5.51 making fresh LLs; trading well below all key EMAs/SMAs while RSI (~33) stays weak (near-oversold).
Bearish continuation: minor bounce fails under $6.3–$7.0, then breakdown to a new swing low as the downtrend (likely Elliott impulse wave 5 of the larger decline) completes.
Relief rally / bottoming attempt: sellers exhaust near $5.4–$5.1, price pushes back toward the broken support band and tests declining MAs (Fib-style mean reversion to prior breakdown zone).
Daily close below $5.45 with follow-through lower the next session
Two daily closes back above $6.95 (EMA50 reclaim/hold)
Buy zones are staged at the current swing-low area (~$5.45), then next likely capitulation pocket (~$4.6) and deeper support (~$4.1–$4.5) while price is below declining EMA50/100 (risk-managed averaging only).
Trims align with mean-reversion to EMA100/EMA200 zone (~$7.7–$8.2) and major overhead supply near the long MAs/SMA200 (~$9+), with full exit into prior distribution/top supply ($11–$13).
As of March 25, 2026, ACHR (Archer Aviation Inc.) is in a falling knife state on the daily chart with 74% confidence. Continued selloff with price at ~$5.51 making fresh LLs; trading well below all key EMAs/SMAs while RSI (~33) stays weak (near-oversold).
On the daily timeframe, ACHR has key support at $5.45 and key resistance at $6.95. The most likely scenario (bearish) targets $5.10 and $4.60, with a revert level at $6.30.
ACHR (Archer Aviation Inc.) is currently classified as falling knife on the daily chart, with 74% confidence. Confirmation requires: Daily close below $5.45 with follow-through lower the next session This would be invalidated by: Two daily closes back above $6.95 (EMA50 reclaim/hold)
The most likely scenario (bearish) targets $5.10 and $4.60, with a revert level at $6.30. The alternative scenario (bullish) targets $6.30 and $7.70.
Multi-layer AI agents analyse 200+ stocks across daily, weekly, and monthly timeframes — producing market state classifications, price scenarios with targets, and position entry/exit levels. Updated every trading day after market close. No paywall. No sign-up required.
Built by Foliotrail.
All content on this website — including charts, analysis, price targets, support/resistance levels, and position zones — is generated entirely by AI and provided for educational and informational purposes only.
This is not financial advice. NEXUSNOIR VENTURES SL (the operator of this website) is not a registered investment adviser or broker-dealer. You should not make investment decisions based solely on this information. Always do your own research and consult a qualified financial advisor.
By continuing, you acknowledge that you have read and agree to our full disclaimer & terms of use and privacy policy.