Archer Aviation Inc. — AI-powered chart analysis updated daily after market close
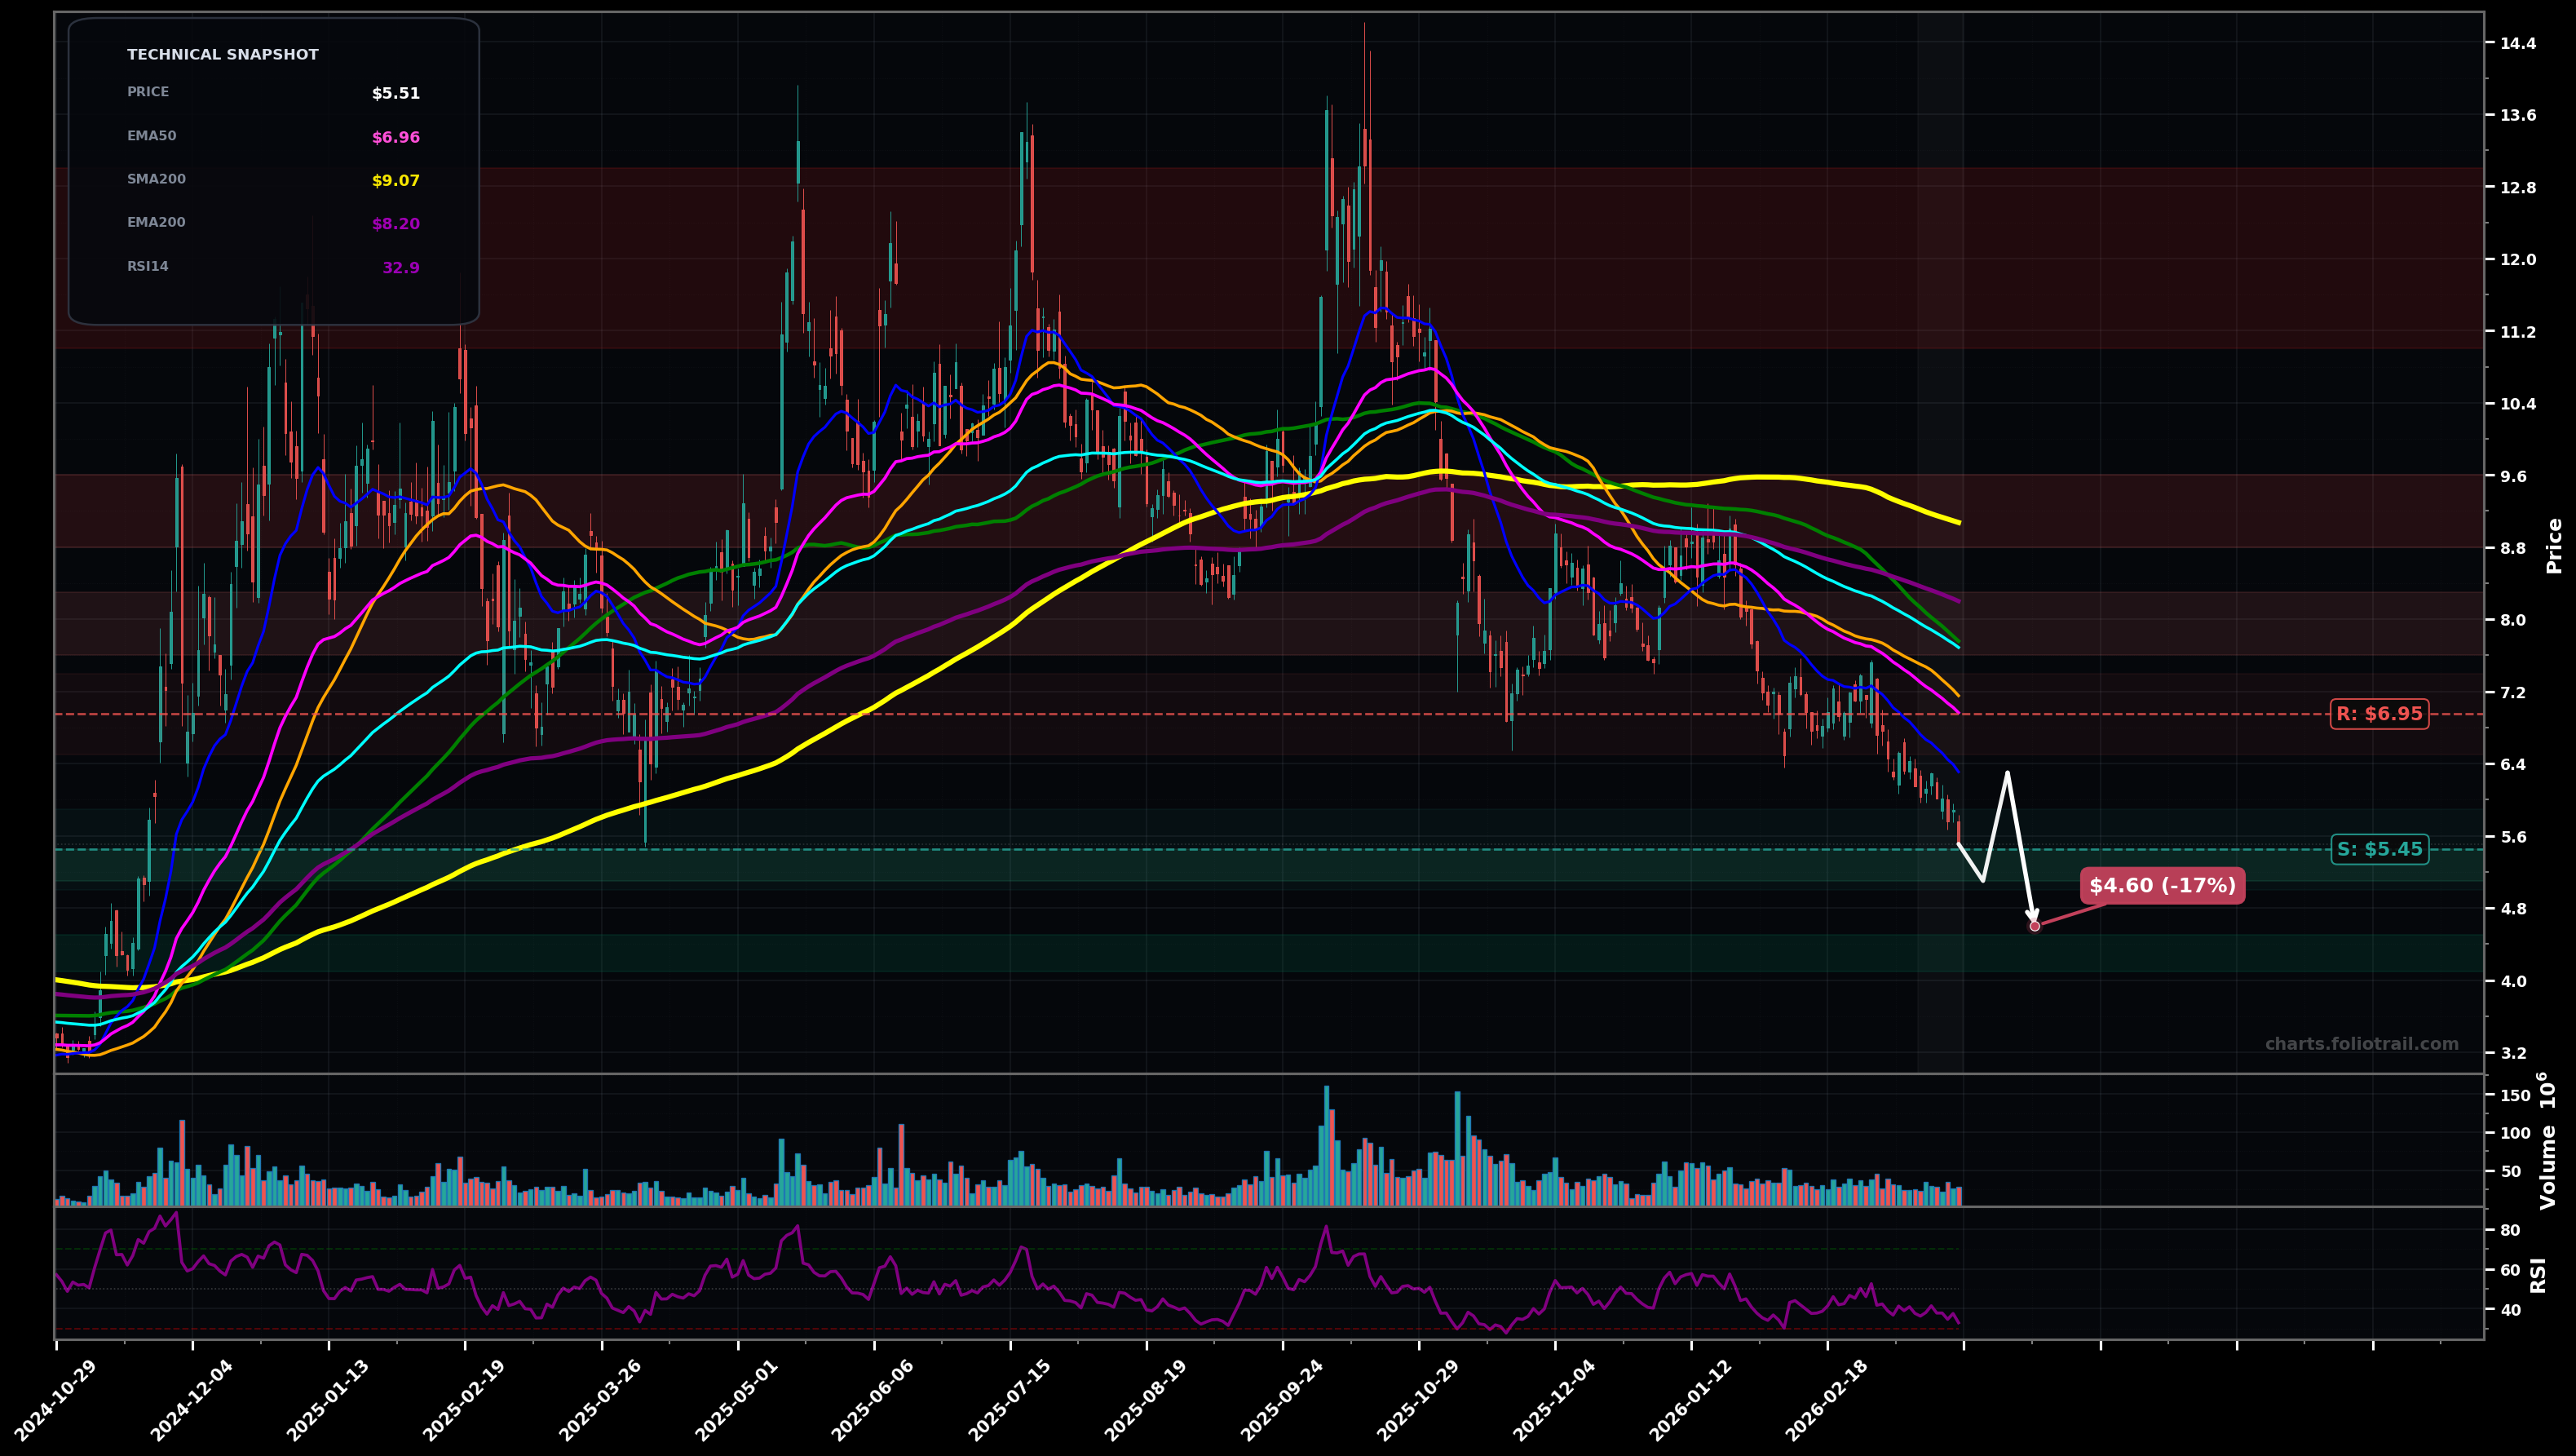
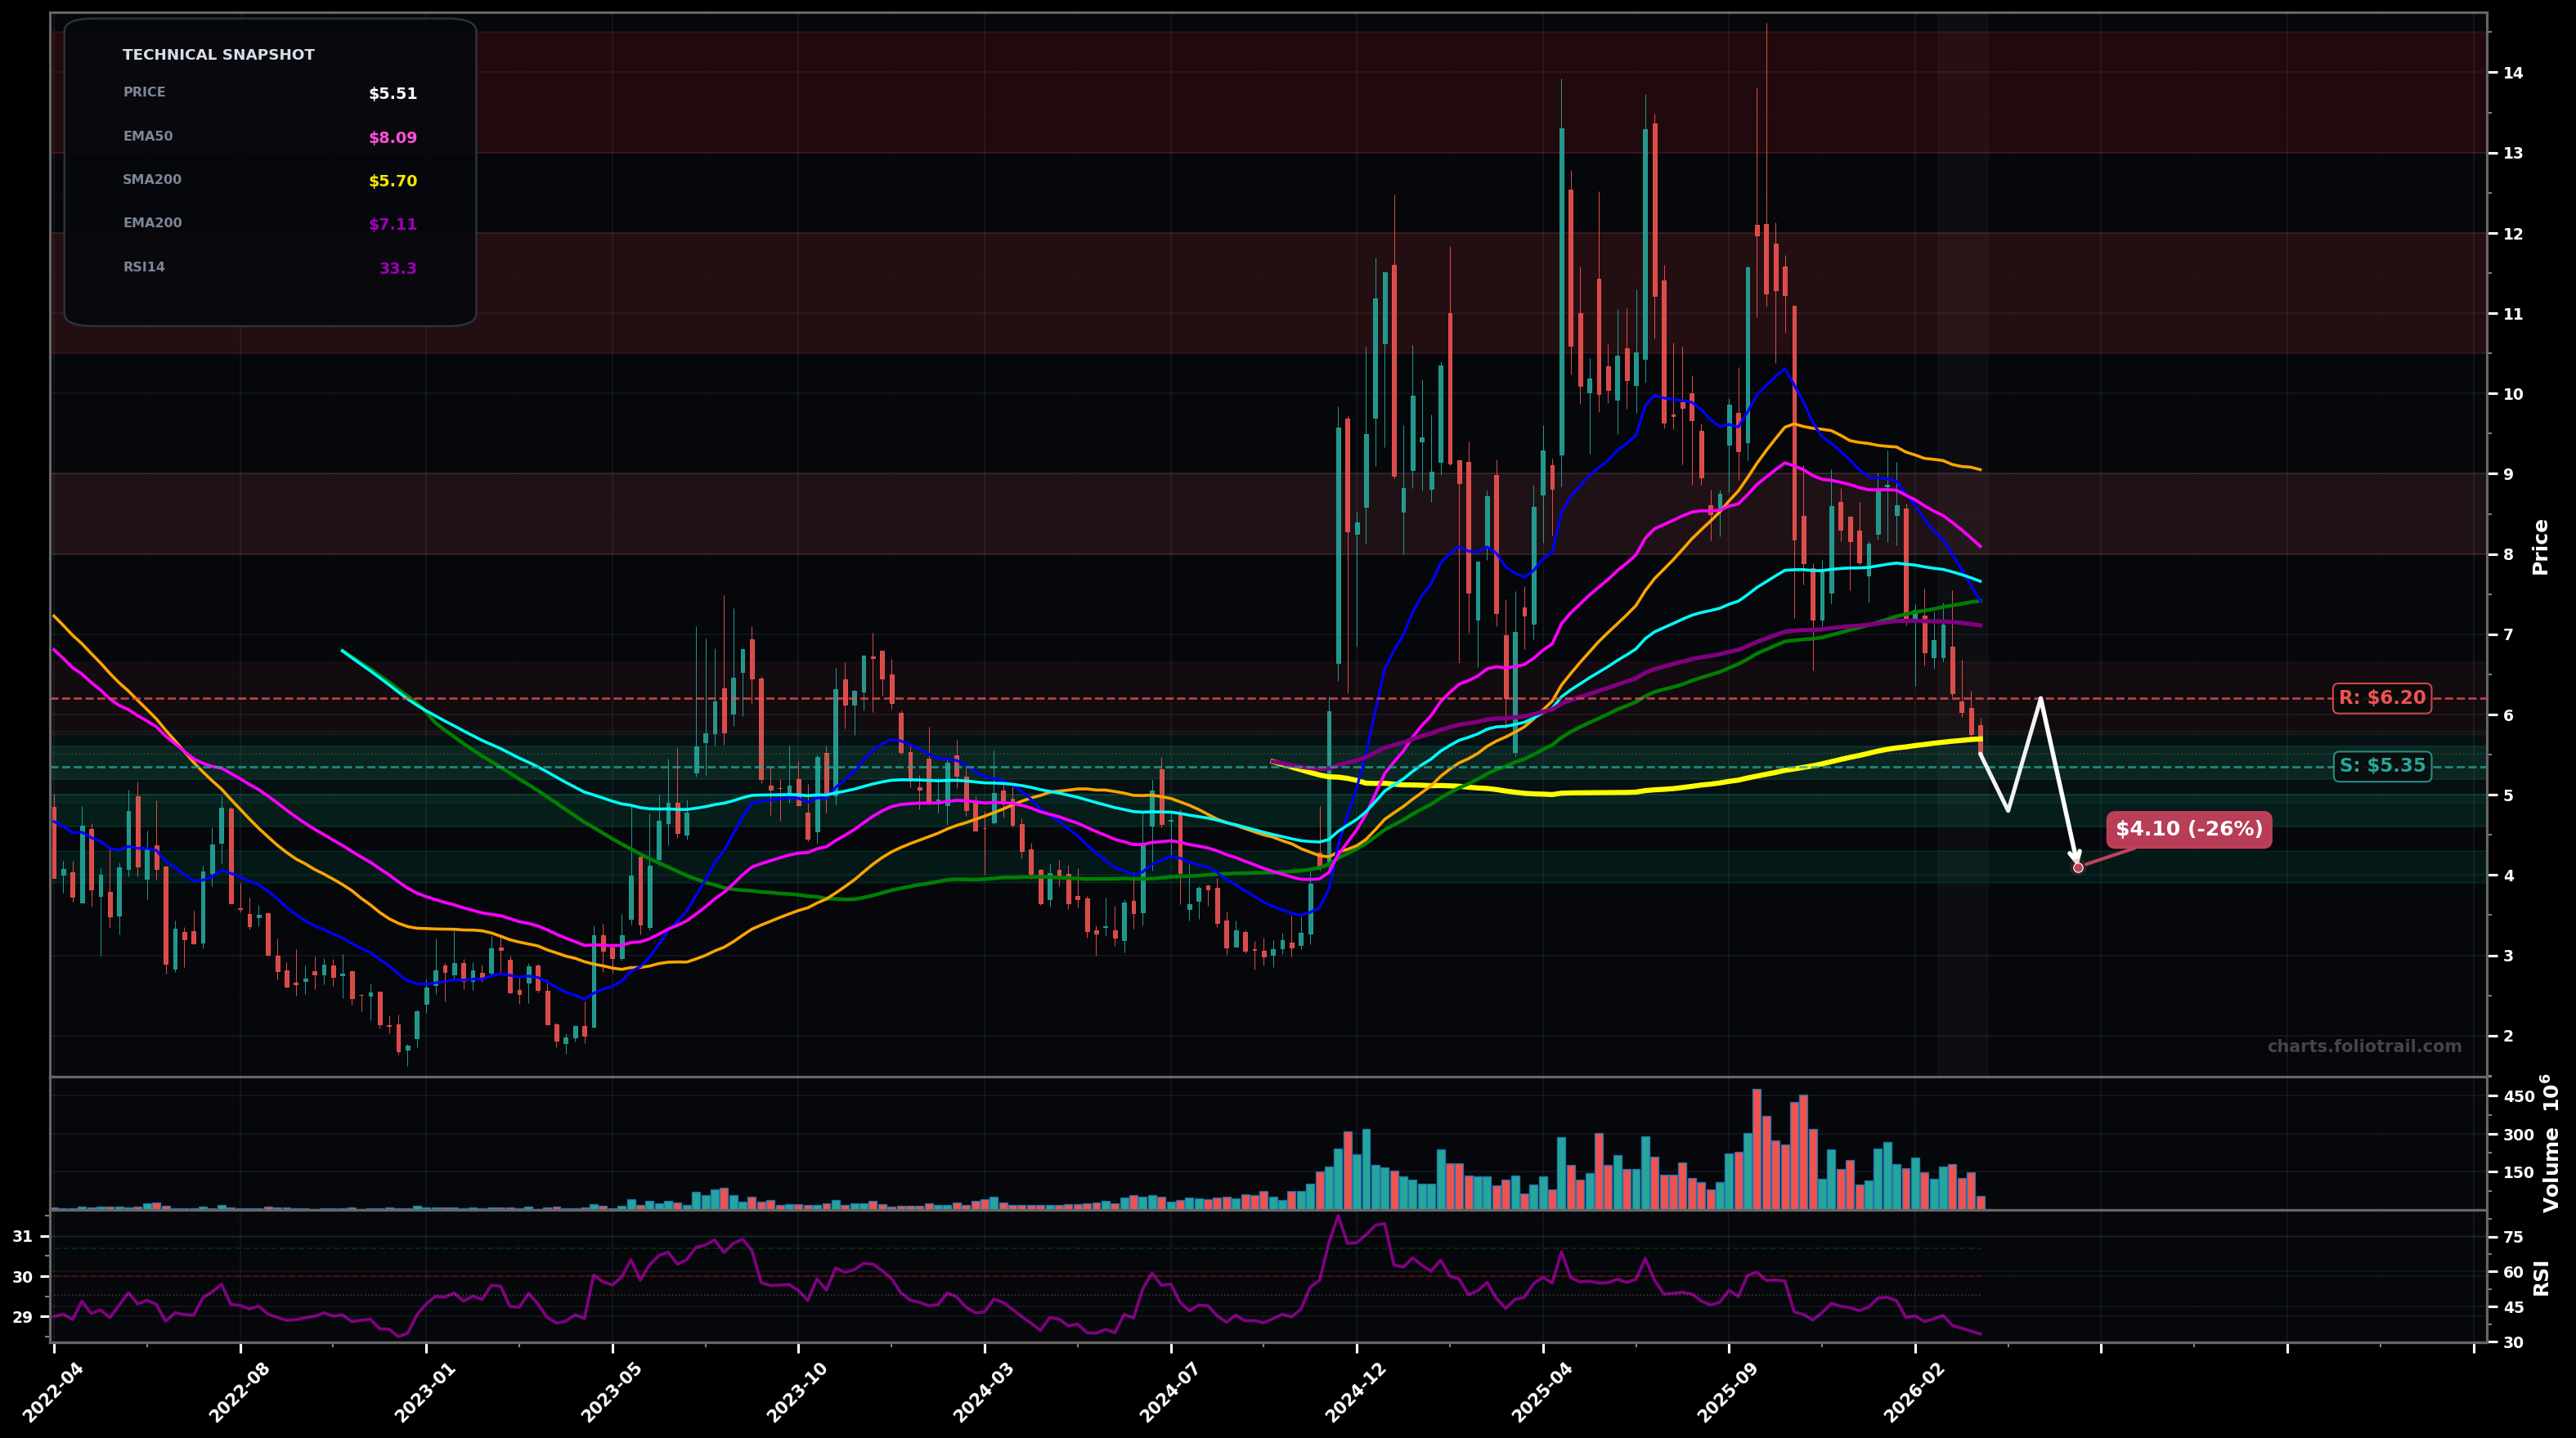
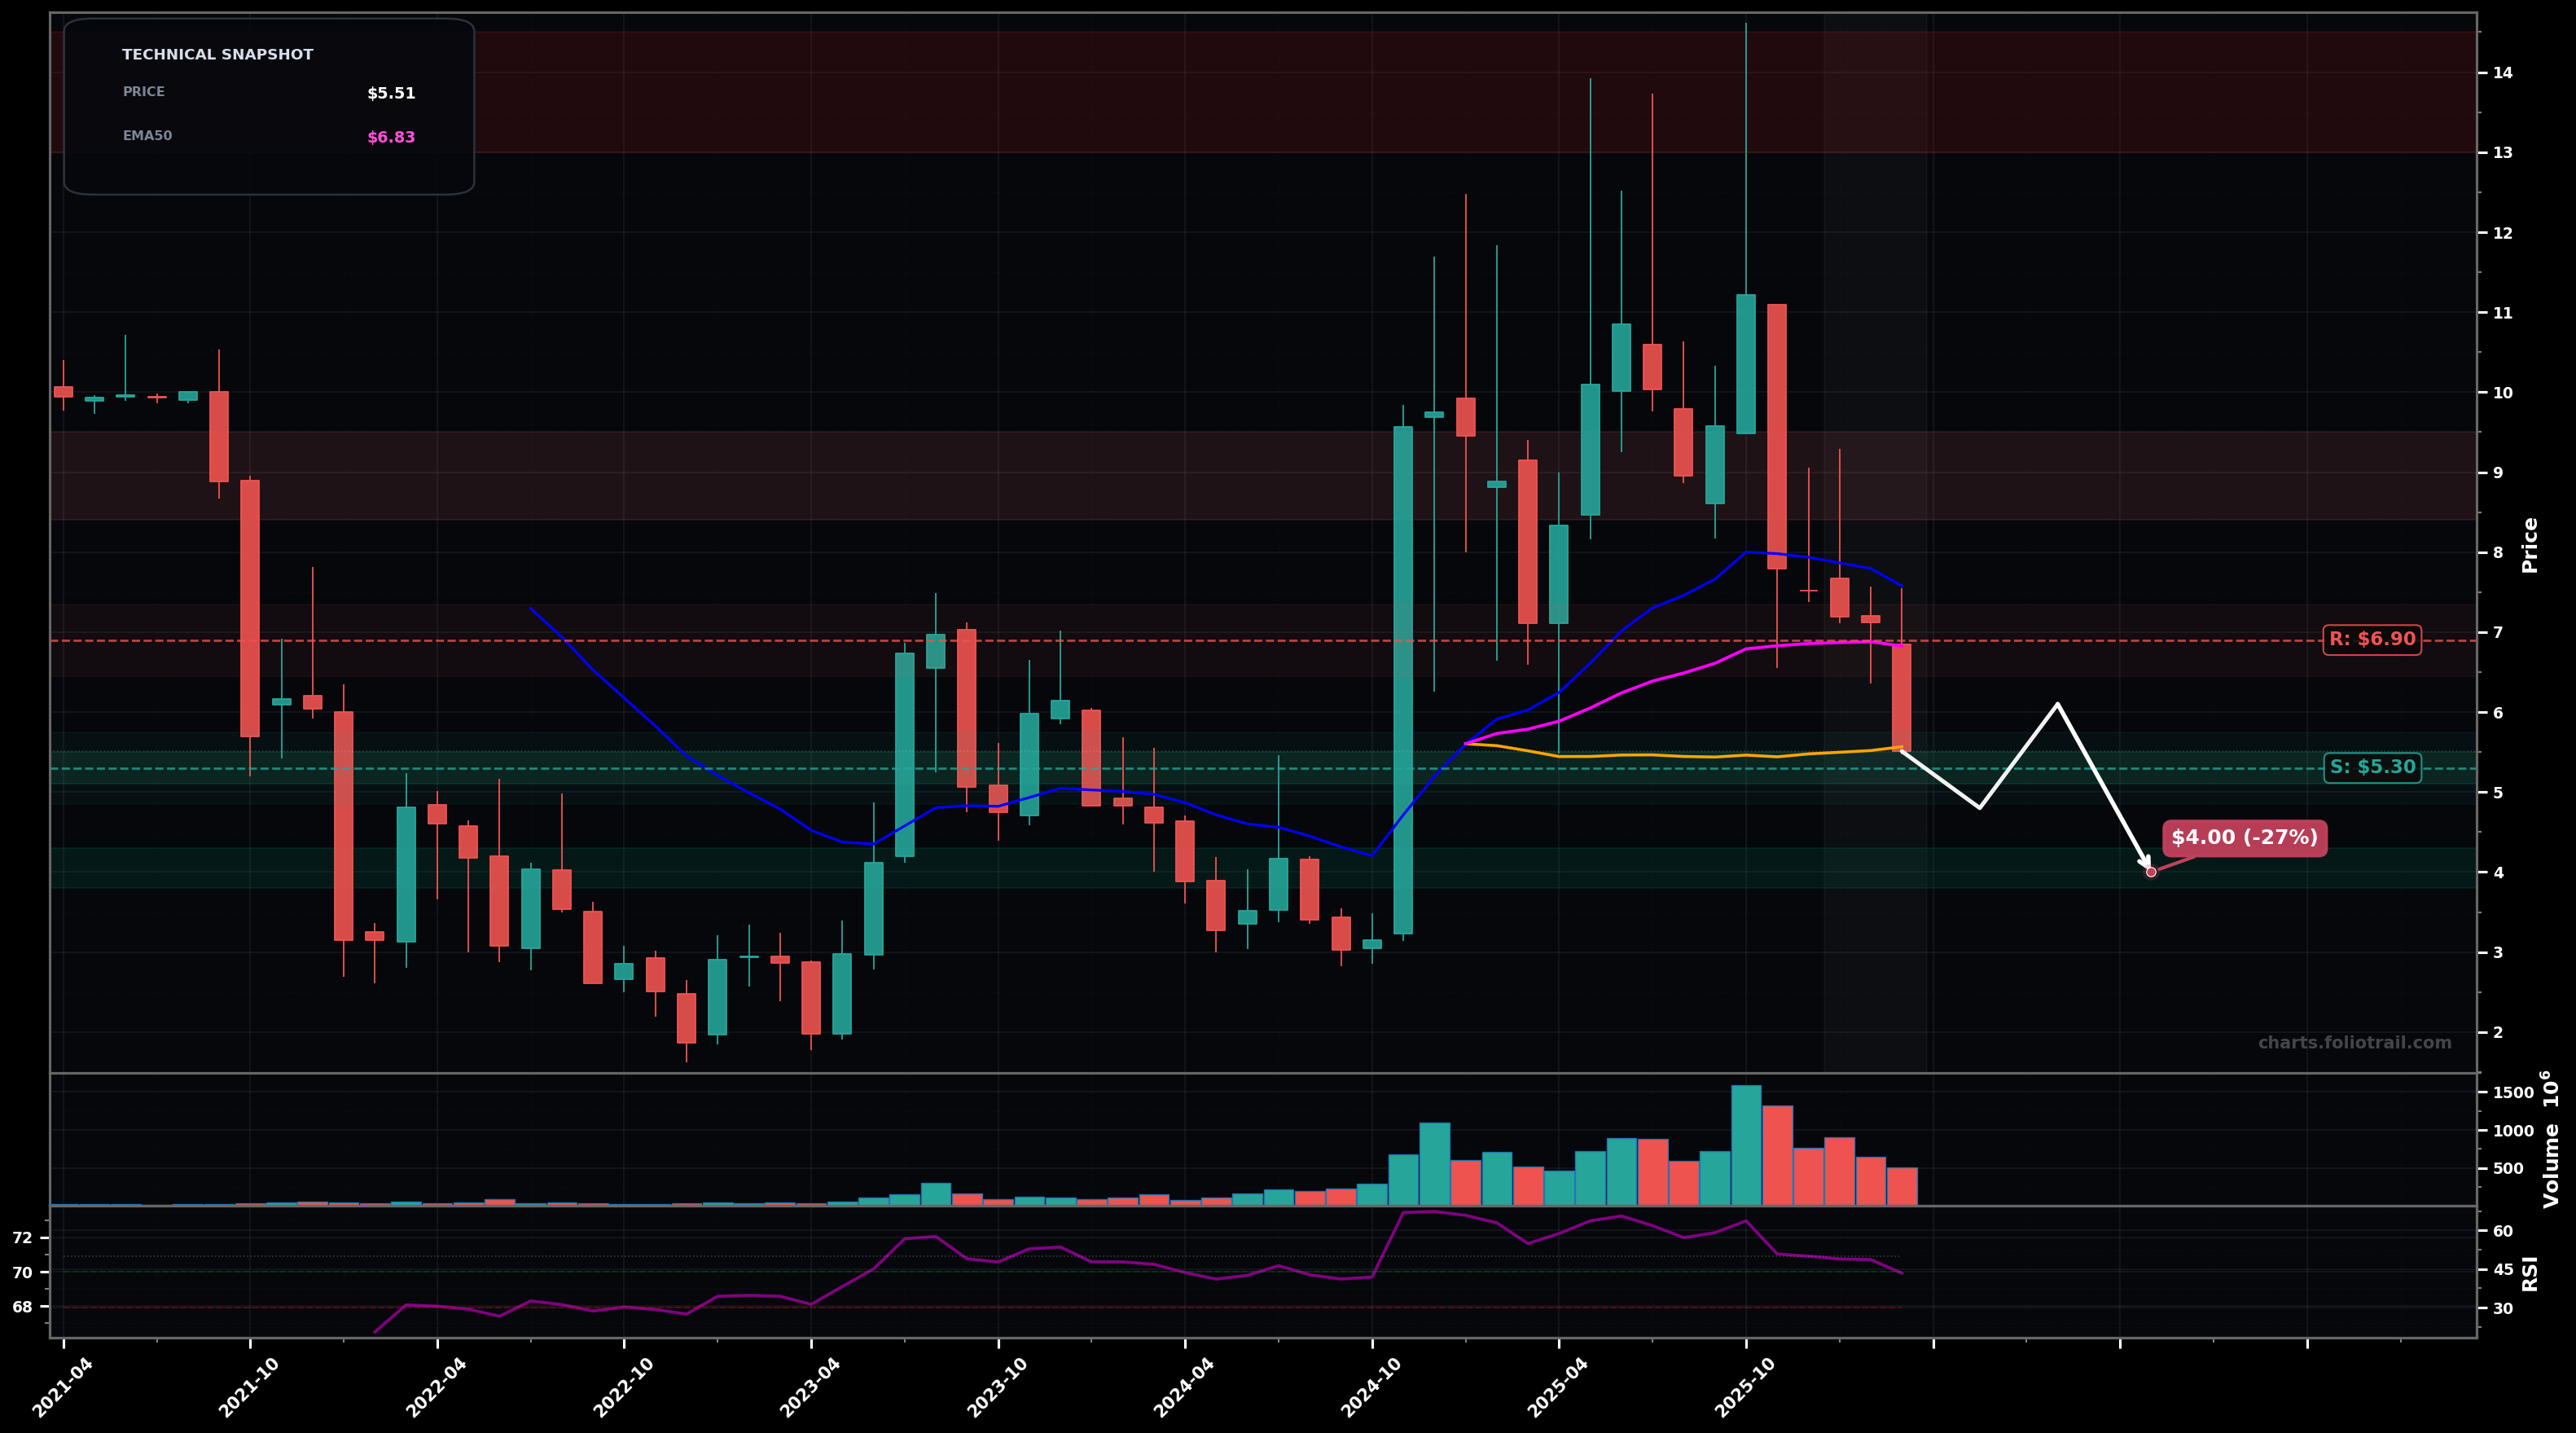
As of March 25, 2026, ACHR (Archer Aviation Inc.) is in a falling knife state on the daily timeframe with 74% confidence. The weekly chart shows a downtrend pattern (72% confidence), while the monthly timeframe indicates downtrend.
As of March 25, 2026, ACHR (Archer Aviation Inc.) is in a falling knife state on the daily timeframe with 74% confidence. Continued selloff with price at ~$5.51 making fresh LLs; trading well below all key EMAs/SMAs while RSI (~33) stays weak (near-oversold).
On the daily chart, ACHR has key support at $5.45 and resistance at $6.95. On the weekly chart, support sits at $5.35 with resistance at $6.20. The monthly timeframe shows support at $5.30 and resistance at $6.90.
FolioCharts provides daily, weekly, and monthly technical analysis for ACHR. Each timeframe is analysed independently by AI agents using moving averages, RSI, and price action.
ACHR technical analysis is updated daily after the US market close. AI agents re-analyse all timeframes using the latest OHLCV price data. Learn more about our methodology.
Multi-layer AI agents analyse 200+ stocks across daily, weekly, and monthly timeframes — producing market state classifications, price scenarios with targets, and position entry/exit levels. Updated every trading day after market close. No paywall. No sign-up required.
Built by Foliotrail.
All content on this website — including charts, analysis, price targets, support/resistance levels, and position zones — is generated entirely by AI and provided for educational and informational purposes only.
This is not financial advice. NEXUSNOIR VENTURES SL (the operator of this website) is not a registered investment adviser or broker-dealer. You should not make investment decisions based solely on this information. Always do your own research and consult a qualified financial advisor.
By continuing, you acknowledge that you have read and agree to our full disclaimer & terms of use and privacy policy.