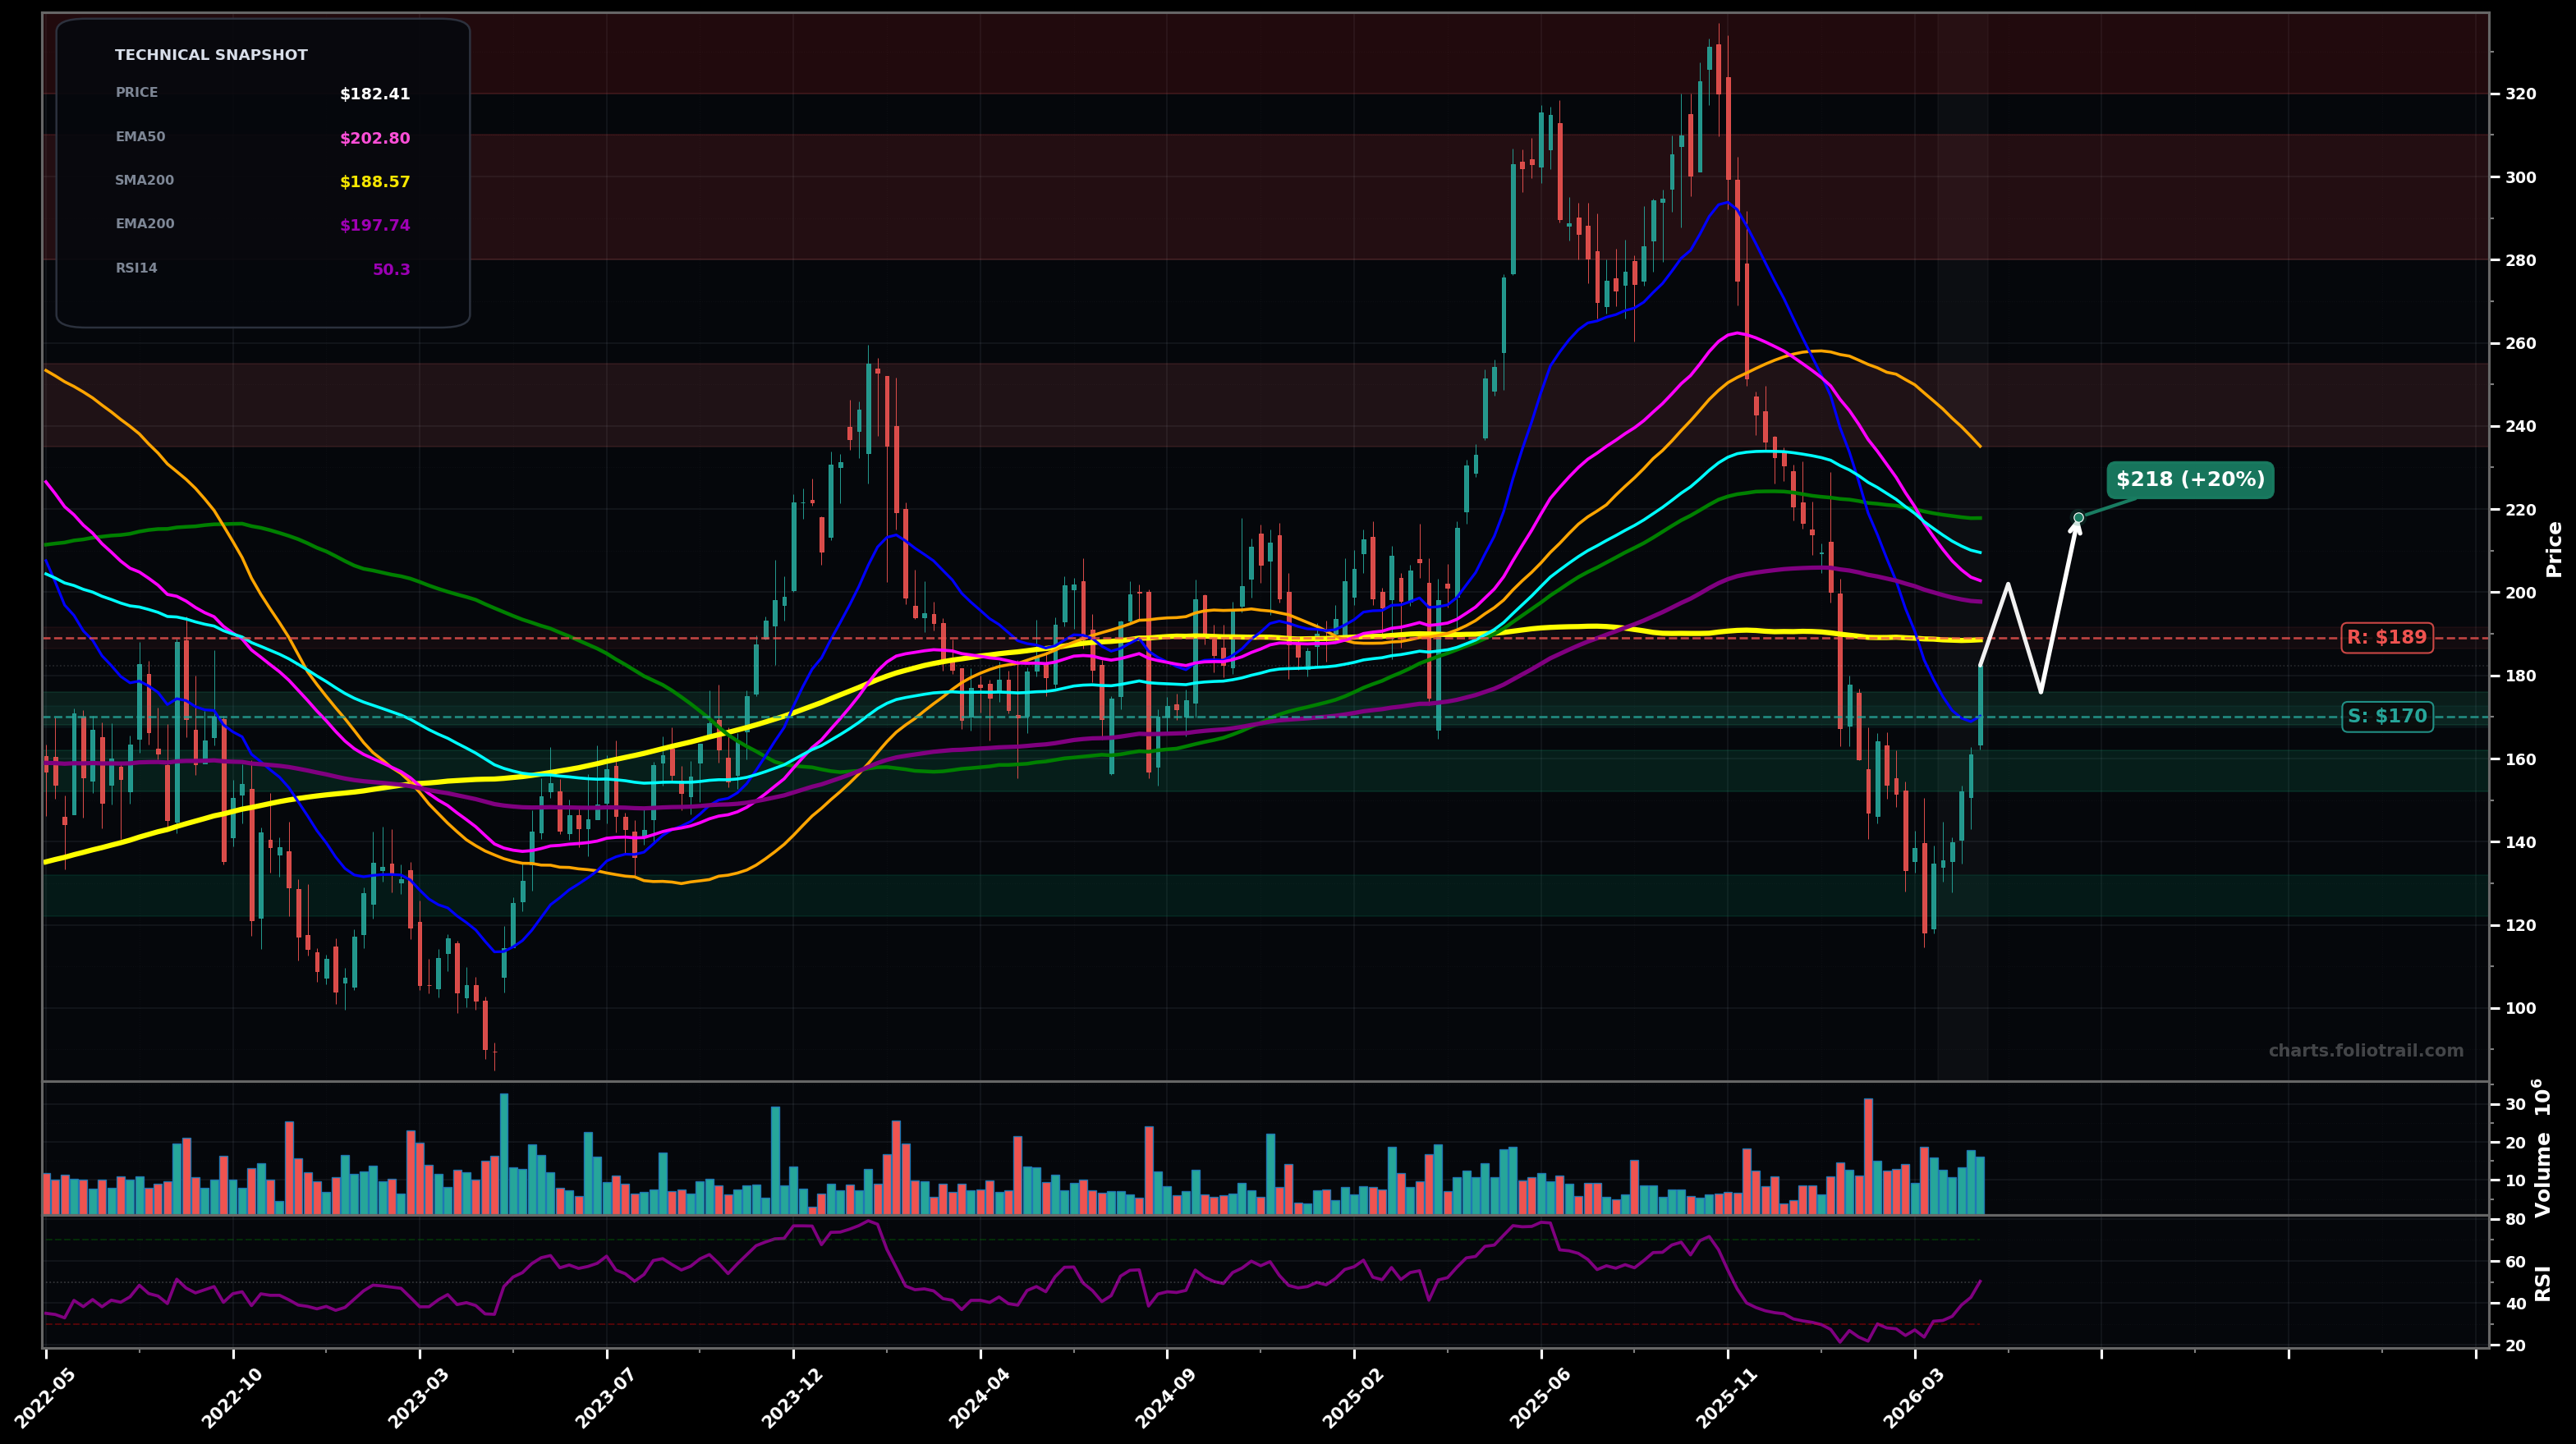
As of May 22, 2026, ZS (Zscaler Inc.) is in a bottoming attempt state on the weekly chart, with a confidence level of 63%. Key support is at $170 and key resistance at $189. Weekly rebound from ~$120–$130 capitulation low; price now ~$182.41 but still below EMA50/EMA100 and under the ~$190–$200 long-term MA cluster; RSI rebounded to ~50.
Base-build under the $188–$200 supply, then grind higher; likely Wave (A)/(1) rebound continues but needs time to absorb overhead MAs. Expect a pullback/retest near $175–$180 before another push.
Rejection at the SMA200/EMA200 area ($188–$198) triggers another leg down (a Wave (C)/(5) flush attempt), revisiting the prior swing low zone; buyers must defend $120–$130 to keep a larger bottoming thesis alive.
Weekly close(s) above $210 holding above EMA100 (cyan) and EMA50 (pink).
Weekly close back below $160 (losing the rebound structure and reopening downside).
Start near EMA20/near-term pivot support, add on breakdown-retest of the $160 shelf, heavy add only at the prior capitulation swing-low demand zone ($120–$130).
Trim into prior supply/major MA extensions (SMA50/SMA100 zones) and close into a full mean-reversion back to the old highs where upside is most stretched vs long-term averages and Fibonacci retrace targets.
As of May 22, 2026, ZS (Zscaler Inc.) is in a bottoming attempt state on the weekly chart with 63% confidence. Weekly rebound from ~$120–$130 capitulation low; price now ~$182.41 but still below EMA50/EMA100 and under the ~$190–$200 long-term MA cluster; RSI rebounded to ~50.
On the weekly timeframe, ZS has key support at $170 and key resistance at $189. The most likely scenario (bullish) targets $202 and $218, with a revert level at $176.
ZS (Zscaler Inc.) is currently classified as bottoming attempt on the weekly chart, with 63% confidence. Confirmation requires: Weekly close(s) above $210 holding above EMA100 (cyan) and EMA50 (pink). This would be invalidated by: Weekly close back below $160 (losing the rebound structure and reopening downside).
The most likely scenario (bullish) targets $202 and $218, with a revert level at $176. The alternative scenario (bearish) targets $160 and $130.
Multi-layer AI agents analyse 200+ stocks across daily, weekly, and monthly timeframes — producing market state classifications, price scenarios with targets, and position entry/exit levels. Daily charts updated every trading day at 6 PM ET. Weekly charts refresh Fridays. Monthly charts refresh on the last trading day of each month. No paywall. No sign-up required.
Built by Foliotrail.
All content on this website — including charts, analysis, price targets, support/resistance levels, and position zones — is generated entirely by AI and provided for educational and informational purposes only.
This is not financial advice. NEXUSNOIR VENTURES SL (the operator of this website) is not a registered investment adviser or broker-dealer. You should not make investment decisions based solely on this information. Always do your own research and consult a qualified financial advisor.
By continuing, you acknowledge that you have read and agree to our full disclaimer & terms of use and privacy policy.