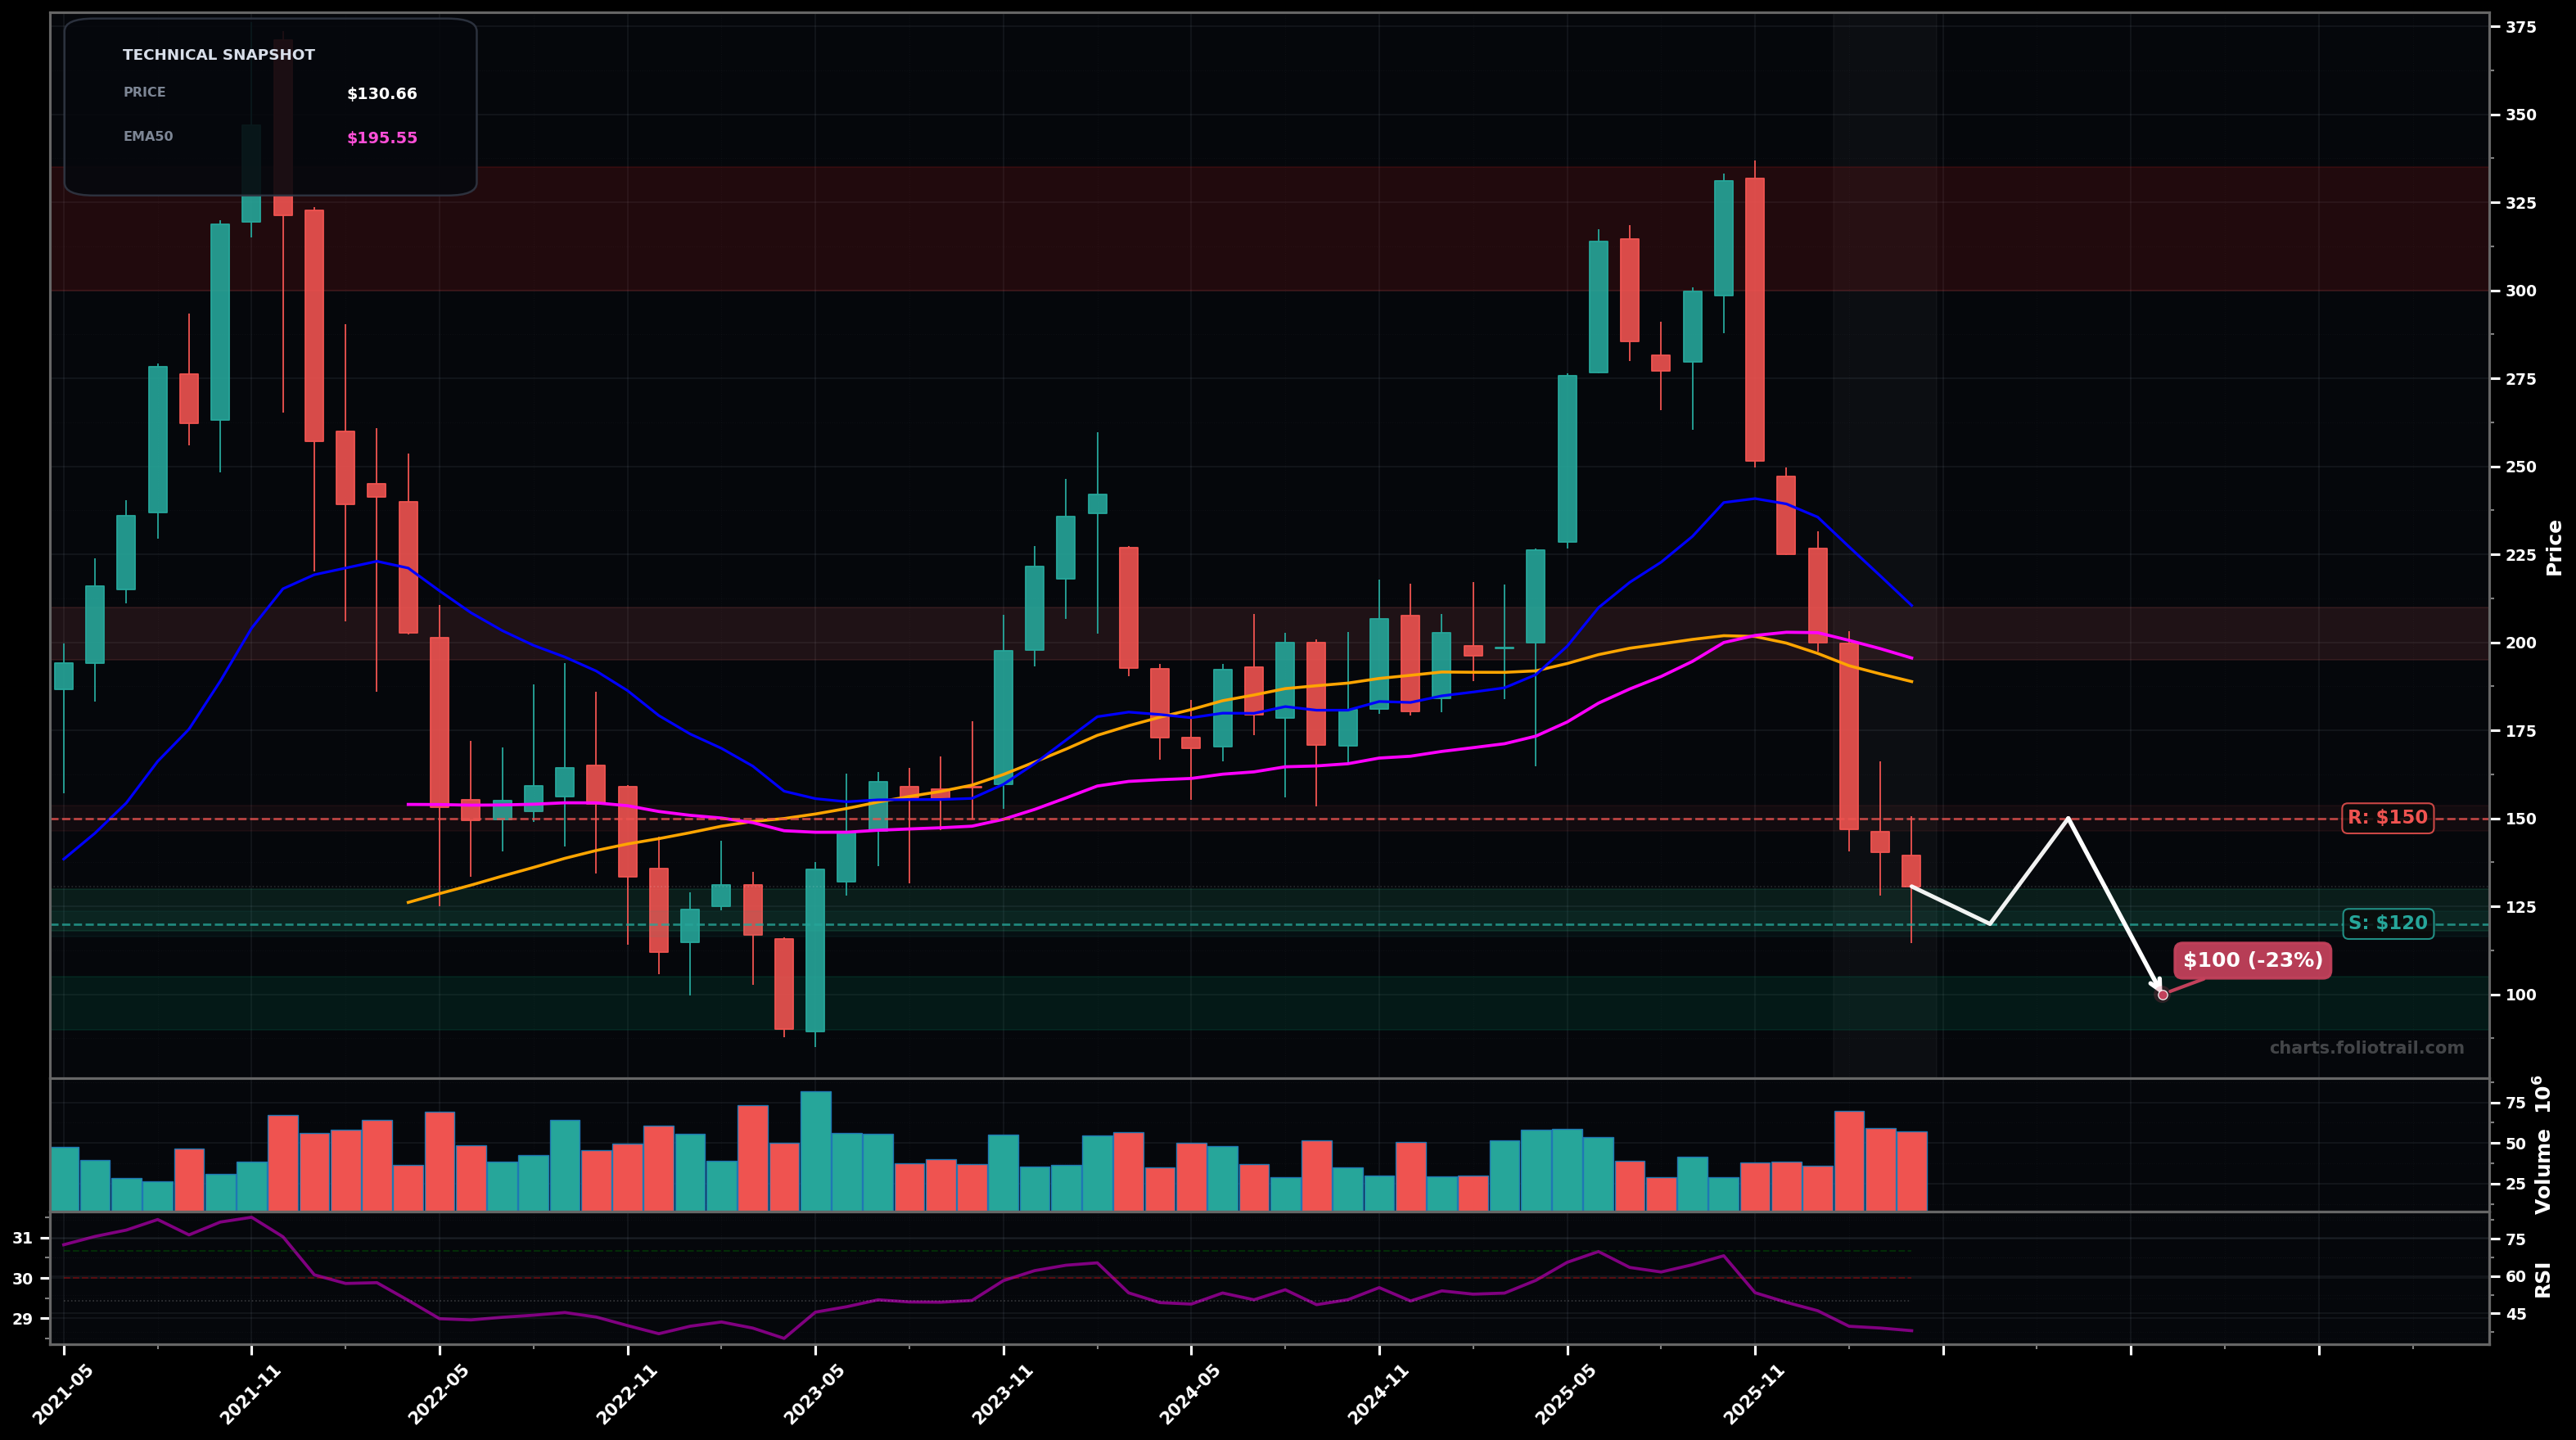
As of April 30, 2026, ZS (Zscaler Inc.) is in a falling knife state on the monthly chart, with a confidence level of 76%. Key support is at $120 and key resistance at $150. Sharp multi-month selloff from the $330s, breaking below the rising MA cluster; last candles show continuation lower toward prior demand with RSI ~38 (not yet oversold).
Bearish continuation into the prior swing-low demand zone, then a relief bounce that likely fails below the ~$150–$165 breakdown area (typical Wave 4/relief within a larger corrective Wave C/3 down).
Bottoming attempt: price holds the ~$120 area (fib/structure support), prints a higher low on monthly, and reclaims ~$150; then mean-reverts toward the EMA50/EMA100 zone (likely a Wave 2/B type retrace).
Monthly close below $120 confirms continuation selling pressure
Monthly close back above $195 (EMA50) invalidates falling-knife and shifts to rebound/base risk
Scale only at prior monthly swing-demand (~$120) and deeper fib/structure support (~$105/$100); heavy adds only if capitulation into ~$90–$105 while preparing for a base.
Trim into MA mean-reversion first (EMA50/EMA100), then larger supply zones from the prior breakdown; full exit into the prior peak supply ($300s) if a full cycle recovery occurs.
As of April 30, 2026, ZS (Zscaler Inc.) is in a falling knife state on the monthly chart with 76% confidence. Sharp multi-month selloff from the $330s, breaking below the rising MA cluster; last candles show continuation lower toward prior demand with RSI ~38 (not yet oversold).
On the monthly timeframe, ZS has key support at $120 and key resistance at $150. The most likely scenario (bearish) targets $120 and $100, with a revert level at $150.
ZS (Zscaler Inc.) is currently classified as falling knife on the monthly chart, with 76% confidence. Confirmation requires: Monthly close below $120 confirms continuation selling pressure This would be invalidated by: Monthly close back above $195 (EMA50) invalidates falling-knife and shifts to rebound/base risk
The most likely scenario (bearish) targets $120 and $100, with a revert level at $150. The alternative scenario (bullish) targets $150 and $195.
Multi-layer AI agents analyse 200+ stocks across daily, weekly, and monthly timeframes — producing market state classifications, price scenarios with targets, and position entry/exit levels. Daily charts updated every trading day at 6 PM ET. Weekly charts refresh Fridays. Monthly charts refresh on the last trading day of each month. No paywall. No sign-up required.
Built by Foliotrail.
All content on this website — including charts, analysis, price targets, support/resistance levels, and position zones — is generated entirely by AI and provided for educational and informational purposes only.
This is not financial advice. NEXUSNOIR VENTURES SL (the operator of this website) is not a registered investment adviser or broker-dealer. You should not make investment decisions based solely on this information. Always do your own research and consult a qualified financial advisor.
By continuing, you acknowledge that you have read and agree to our full disclaimer & terms of use and privacy policy.