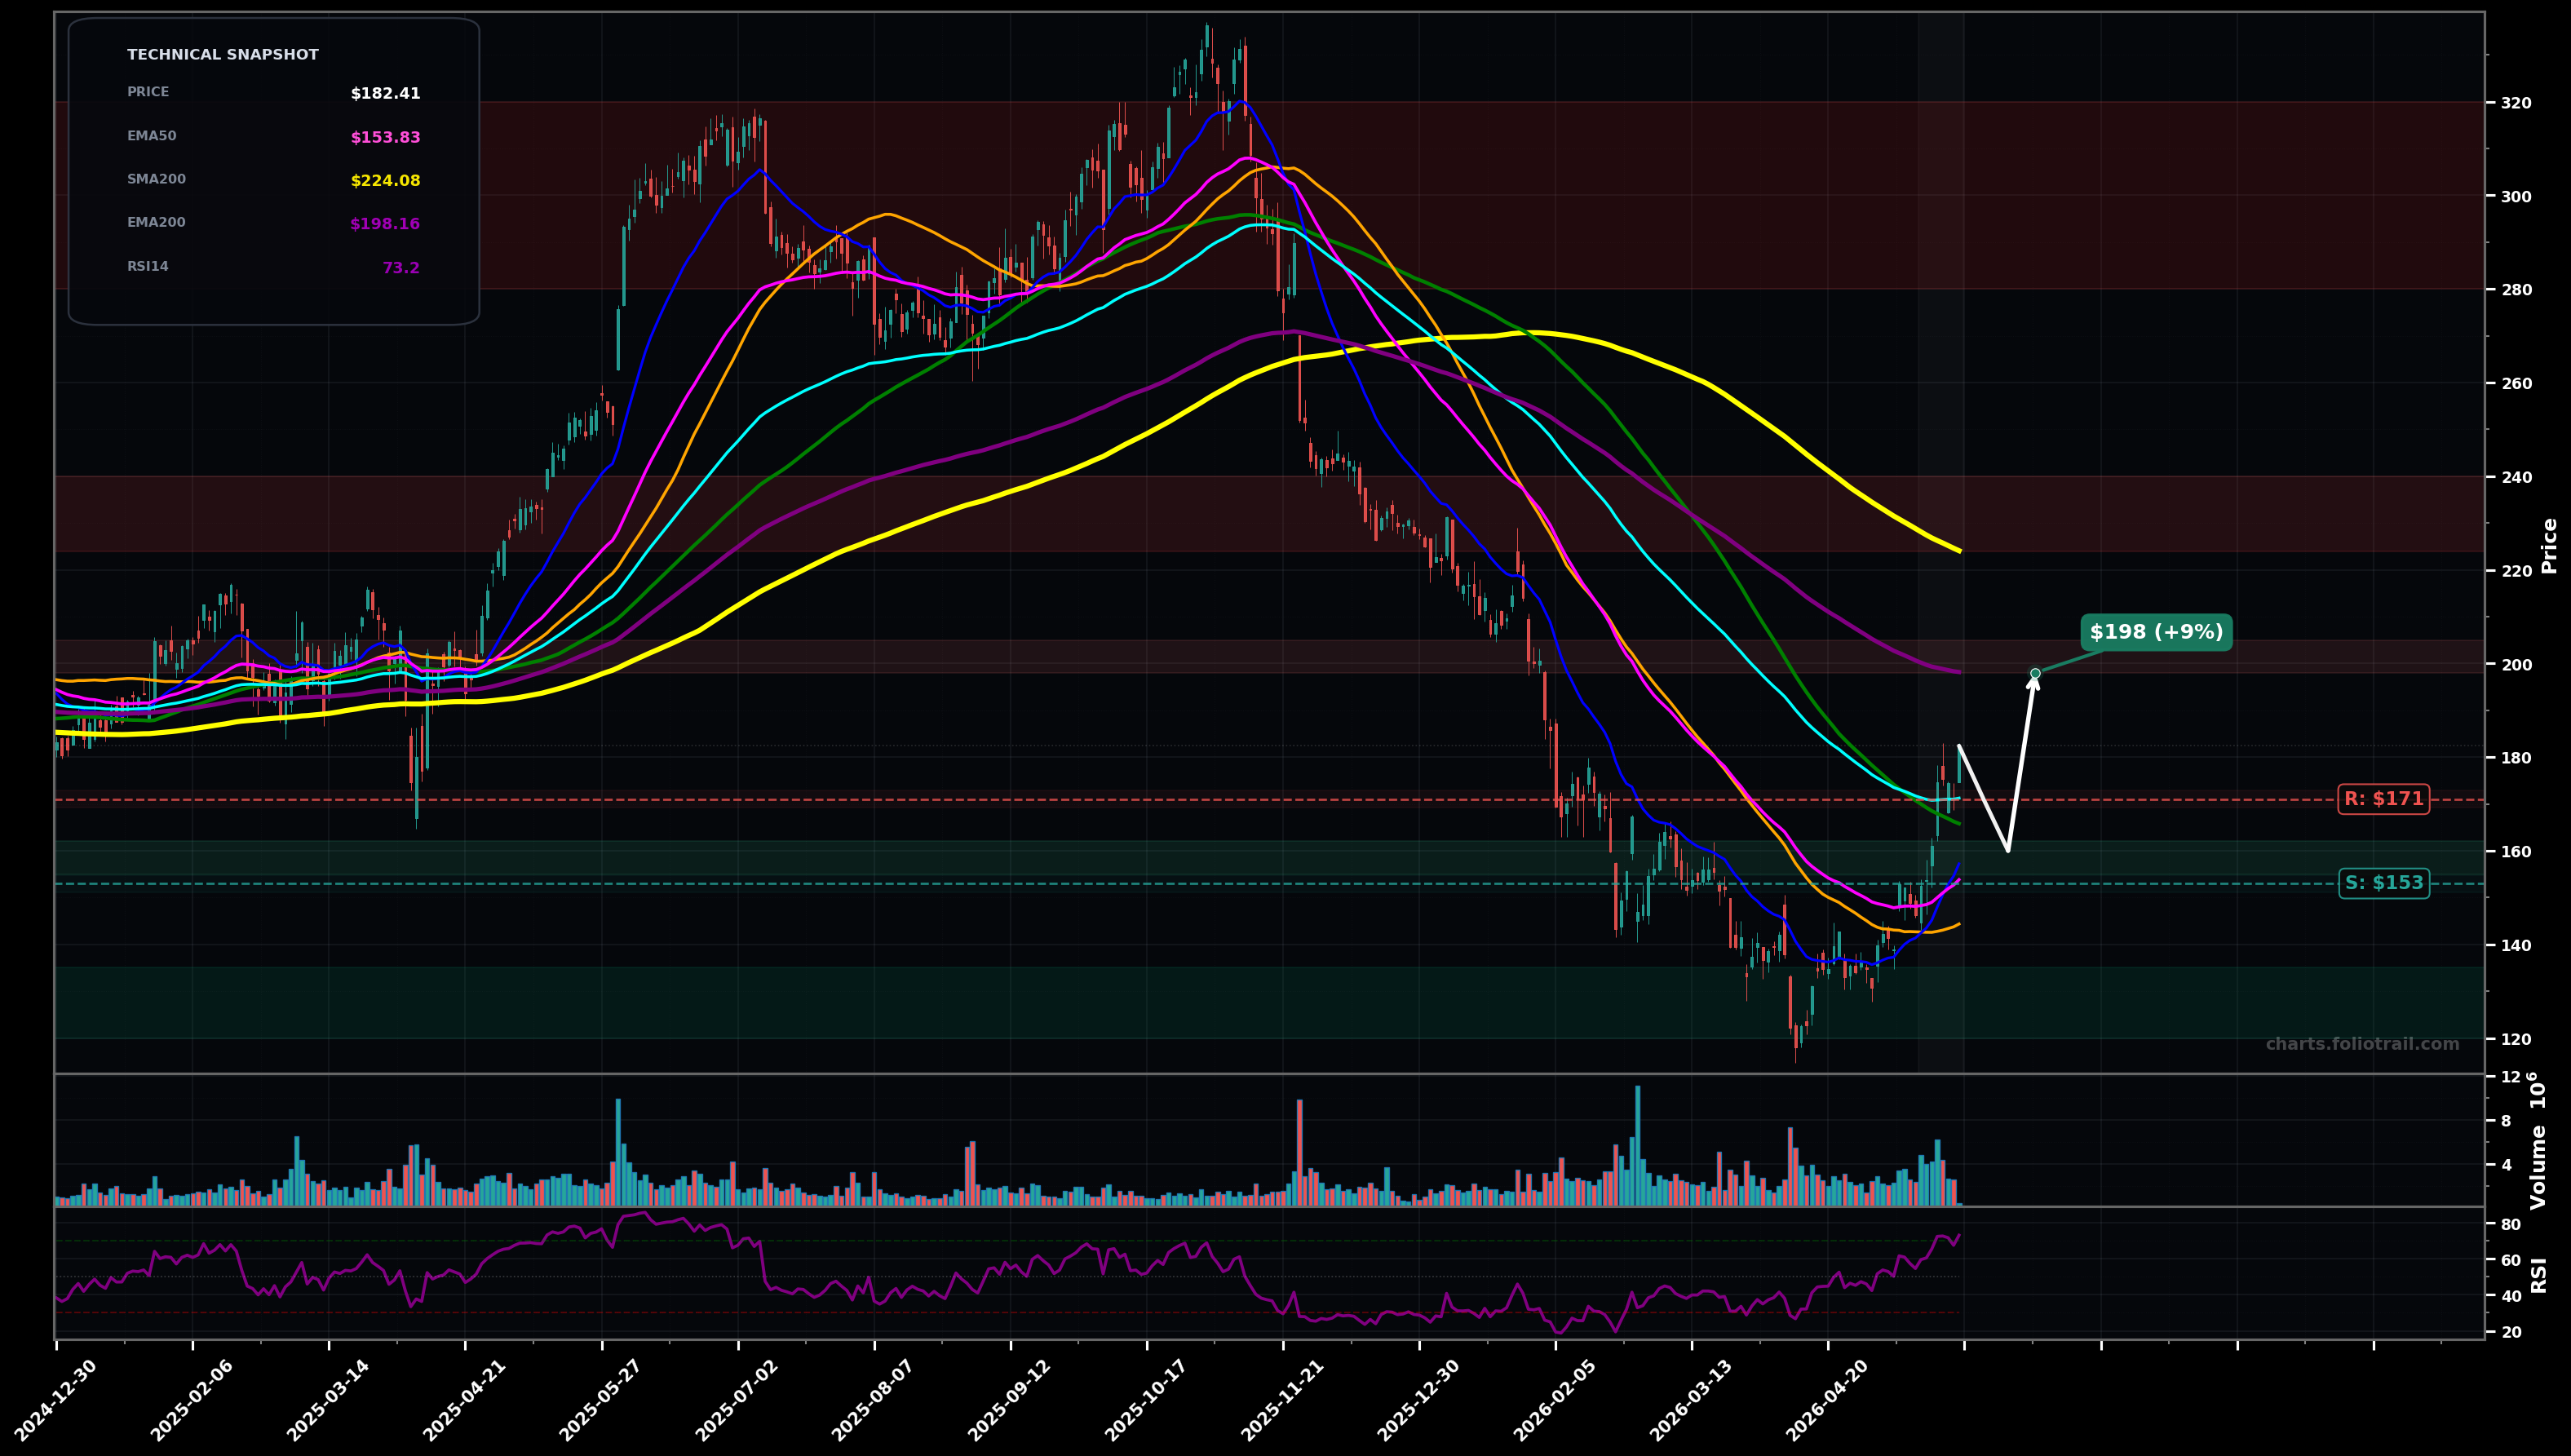
As of May 22, 2026, ZS (Zscaler Inc.) is in a bottoming attempt state on the daily chart, with a confidence level of 66%. Key support is at $153 and key resistance at $171. Sharp rebound from the ~$120 swing low, now breaking above the prior consolidation and reclaiming short-term MAs; price is still below the larger downtrend MAs (EMA100/200, SMA200).
Bullish continuation: pullback holds above reclaimed EMA50, then push into/through the $171 zone; if cleared, price likely mean-reverts toward the next supply cluster near $198-$200 (EMA200) and then $224 (SMA200). Rough probability 60%.
Bearish fade: RSI-overbought rally rejects at $171, rolls over and retests the base; a failure to hold the reclaimed short-term MAs risks a deeper retest toward the ~$140 area and possibly the ~$120 swing low. Rough probability 40%.
Daily close above $171 (EMA100 area) for 2+ sessions
Daily close back below $153 (EMA50 area)
Start on controlled pullbacks above EMA50; add on EMA50/SMA50 confluence retest; heavy add only near prior capitulation/base lows (swing-low support).
Trim into major overhead MAs (EMA200/SMA200) and prior breakdown supply; close into a full mean-reversion toward the old distribution zone highs where upside becomes most stretched.
As of May 22, 2026, ZS (Zscaler Inc.) is in a bottoming attempt state on the daily chart with 66% confidence. Sharp rebound from the ~$120 swing low, now breaking above the prior consolidation and reclaiming short-term MAs; price is still below the larger downtrend MAs (EMA100/200, SMA200).
On the daily timeframe, ZS has key support at $153 and key resistance at $171. The most likely scenario (bullish) targets $171 and $198, with a revert level at $160.
ZS (Zscaler Inc.) is currently classified as bottoming attempt on the daily chart, with 66% confidence. Confirmation requires: Daily close above $171 (EMA100 area) for 2+ sessions This would be invalidated by: Daily close back below $153 (EMA50 area)
The most likely scenario (bullish) targets $171 and $198, with a revert level at $160. The alternative scenario (bearish) targets $153 and $140.
Multi-layer AI agents analyse 200+ stocks across daily, weekly, and monthly timeframes — producing market state classifications, price scenarios with targets, and position entry/exit levels. Daily charts updated every trading day at 6 PM ET. Weekly charts refresh Fridays. Monthly charts refresh on the last trading day of each month. No paywall. No sign-up required.
Built by Foliotrail.
All content on this website — including charts, analysis, price targets, support/resistance levels, and position zones — is generated entirely by AI and provided for educational and informational purposes only.
This is not financial advice. NEXUSNOIR VENTURES SL (the operator of this website) is not a registered investment adviser or broker-dealer. You should not make investment decisions based solely on this information. Always do your own research and consult a qualified financial advisor.
By continuing, you acknowledge that you have read and agree to our full disclaimer & terms of use and privacy policy.