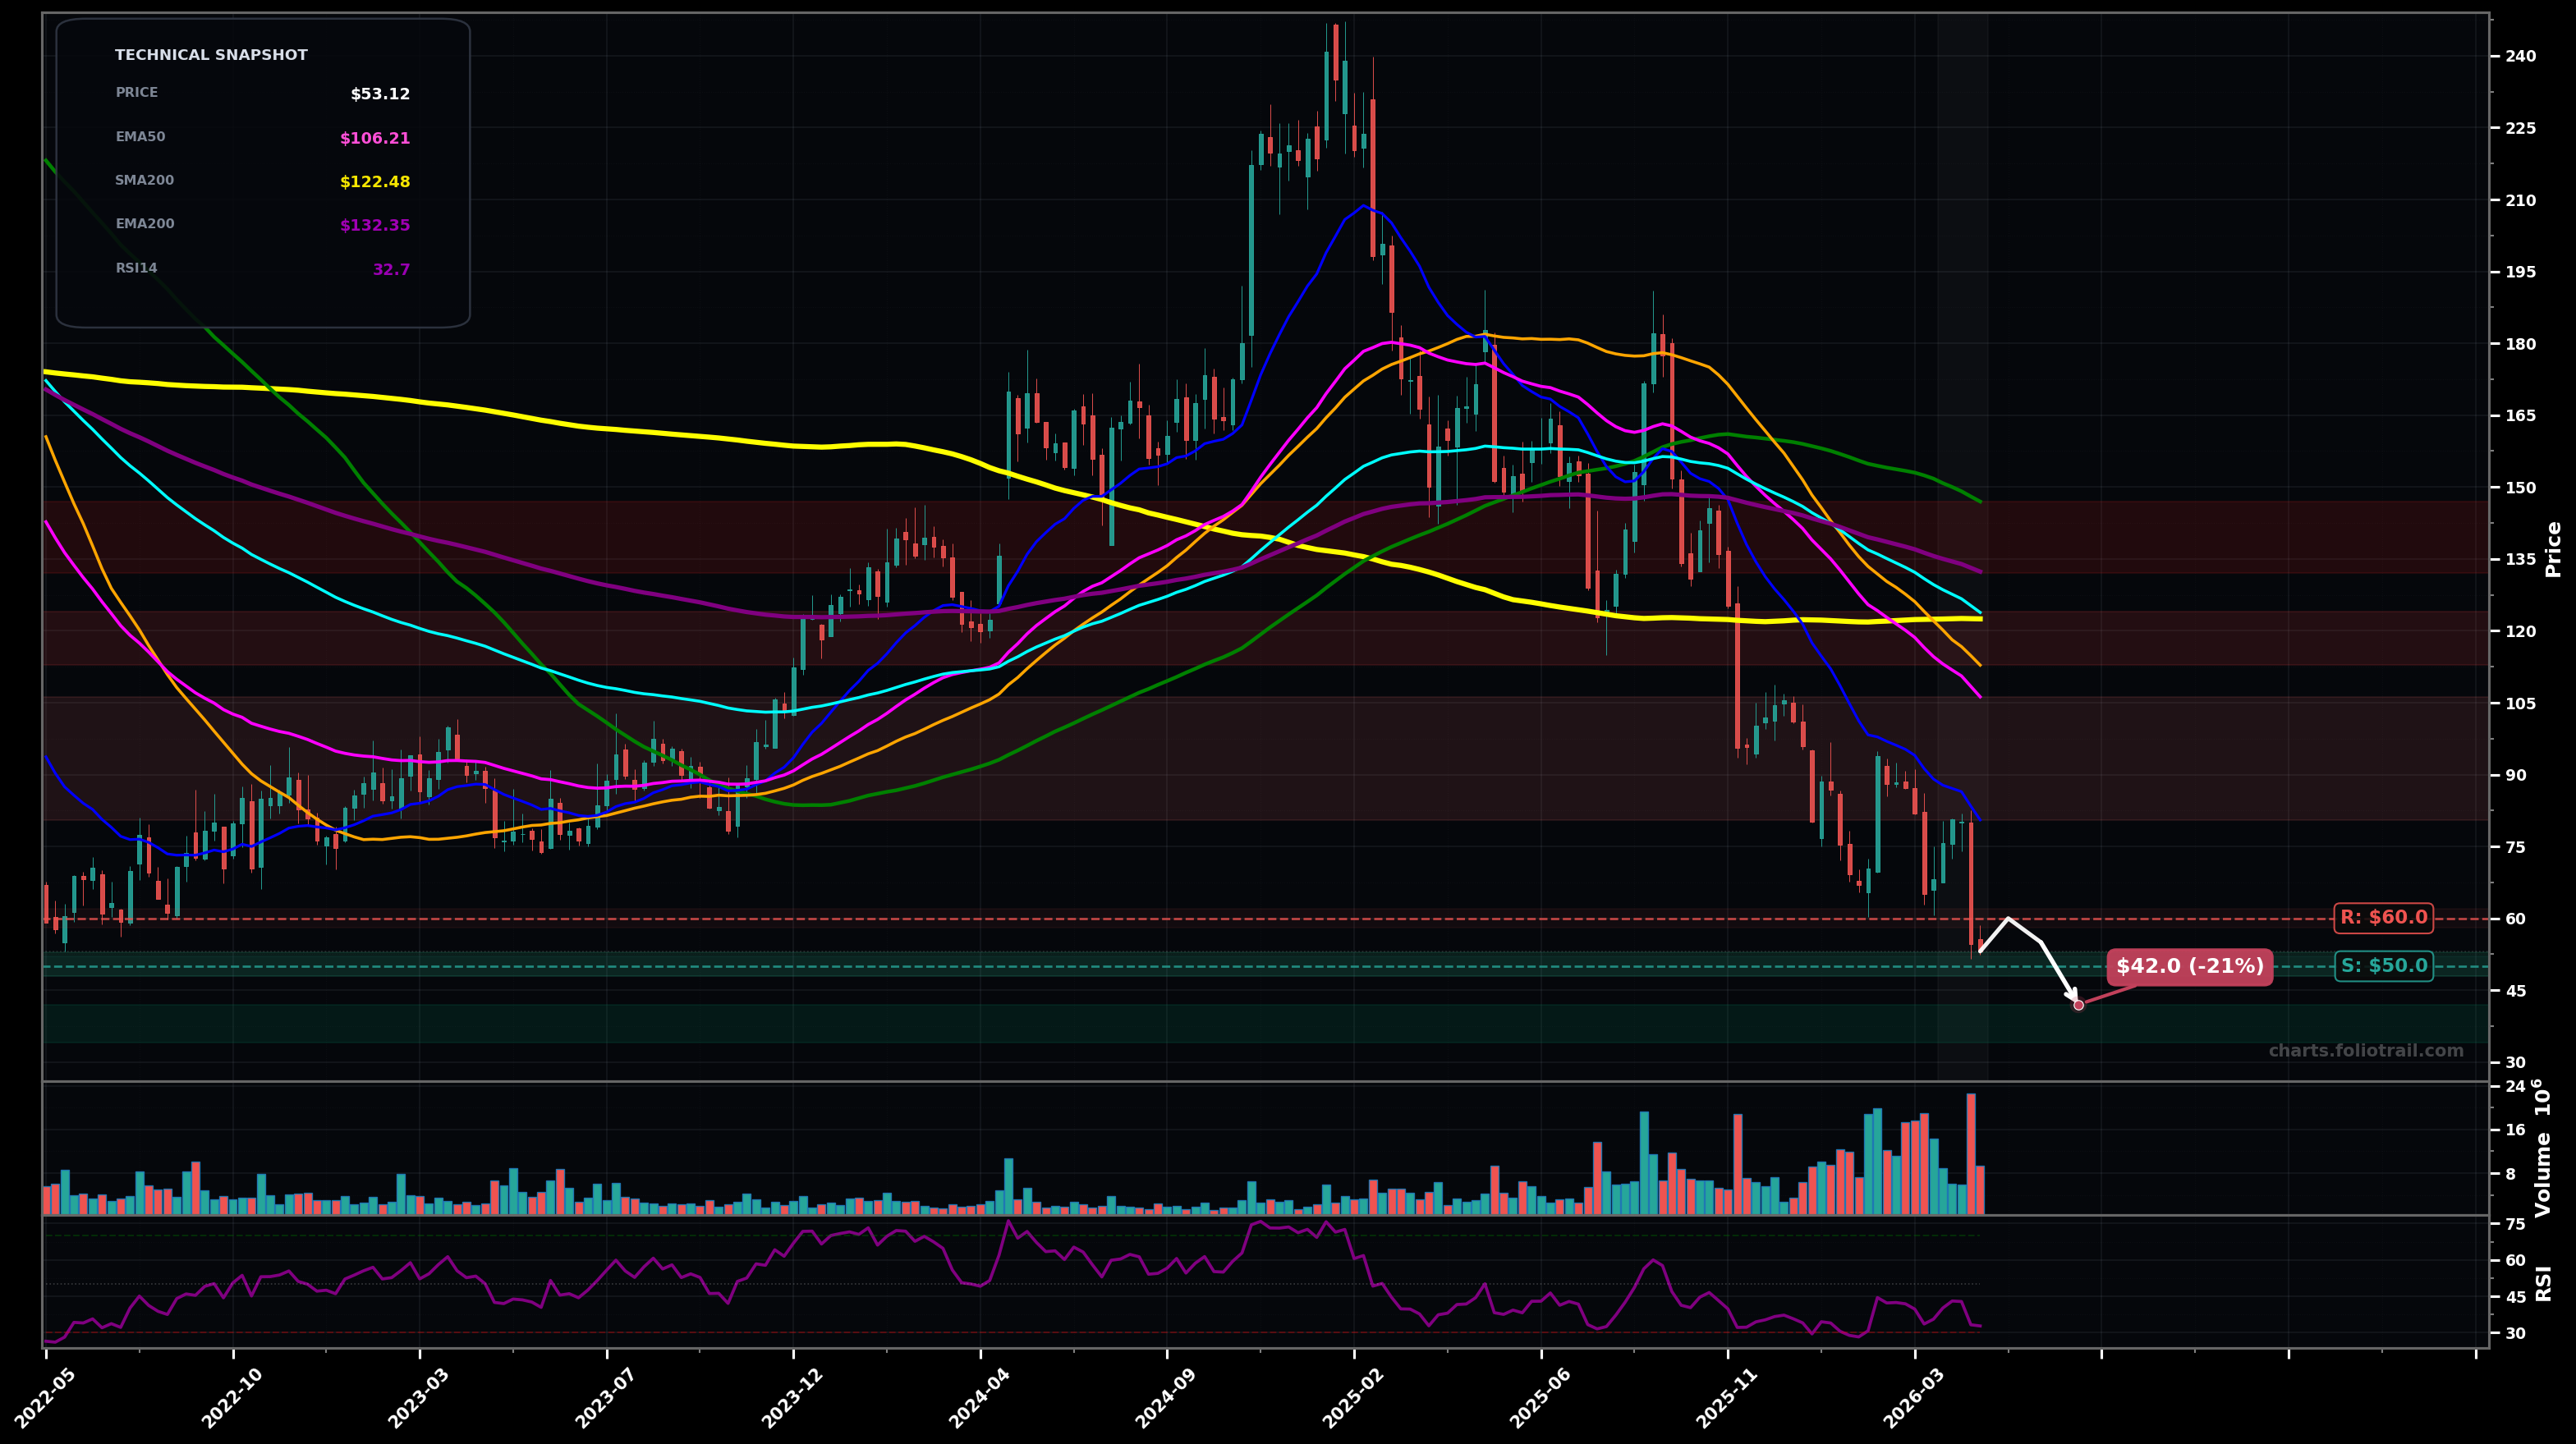
As of May 22, 2026, WIX (Wix.com Ltd.) is in a falling knife state on the weekly chart, with a confidence level of 78%. Key support is at $50.0 and key resistance at $60.0. Weekly downtrend persists; price ~$53.12 made fresh swing-low with heavy sell volume, far below all key EMAs/SMAs; RSI ~32.7 (near oversold) showing weak bounce attempts.
Dead-cat bounce / short-covering rally into first moving-average resistance, then rejection and another LL (Elliott: still in wave 3/5 down; any bounce likely wave 4 corrective). Prob ~60%.
Capitulation-to-base attempt: undercut $50 then reclaim it and grind sideways, building a STABILIZED_BASE before any larger reversal (Elliott: ending 5th wave / starting A-B-C corrective up). Prob ~40%.
Weekly close below $50.00 with follow-through (another lower low) would confirm continuation risk
2+ weekly closes back above $80.50 (EMA20) would invalidate falling-knife behavior and shift to a base/reversal watch
Use swing-low support ($50) and likely Fibonacci extension zone below as staged entries; heavy add only on capitulation/flush where risk-reward improves.
Trim into successive mean-reversion layers: EMA20/EMA50 first, then SMA50/EMA100 area, then major long-term MAs (EMA200/SMA100) where multi-year stretch risk rises.
As of May 22, 2026, WIX (Wix.com Ltd.) is in a falling knife state on the weekly chart with 78% confidence. Weekly downtrend persists; price ~$53.12 made fresh swing-low with heavy sell volume, far below all key EMAs/SMAs; RSI ~32.7 (near oversold) showing weak bounce attempts.
On the weekly timeframe, WIX has key support at $50.0 and key resistance at $60.0. The most likely scenario (bearish) targets $60.0 and $42.0, with a revert level at $55.0.
WIX (Wix.com Ltd.) is currently classified as falling knife on the weekly chart, with 78% confidence. Confirmation requires: Weekly close below $50.00 with follow-through (another lower low) would confirm continuation risk This would be invalidated by: 2+ weekly closes back above $80.50 (EMA20) would invalidate falling-knife behavior and shift to a base/reversal watch
The most likely scenario (bearish) targets $60.0 and $42.0, with a revert level at $55.0. The alternative scenario (bullish) targets $70.0 and $80.5.
Multi-layer AI agents analyse 200+ stocks across daily, weekly, and monthly timeframes — producing market state classifications, price scenarios with targets, and position entry/exit levels. Daily charts updated every trading day at 6 PM ET. Weekly charts refresh Fridays. Monthly charts refresh on the last trading day of each month. No paywall. No sign-up required.
Built by Foliotrail.
All content on this website — including charts, analysis, price targets, support/resistance levels, and position zones — is generated entirely by AI and provided for educational and informational purposes only.
This is not financial advice. NEXUSNOIR VENTURES SL (the operator of this website) is not a registered investment adviser or broker-dealer. You should not make investment decisions based solely on this information. Always do your own research and consult a qualified financial advisor.
By continuing, you acknowledge that you have read and agree to our full disclaimer & terms of use and privacy policy.