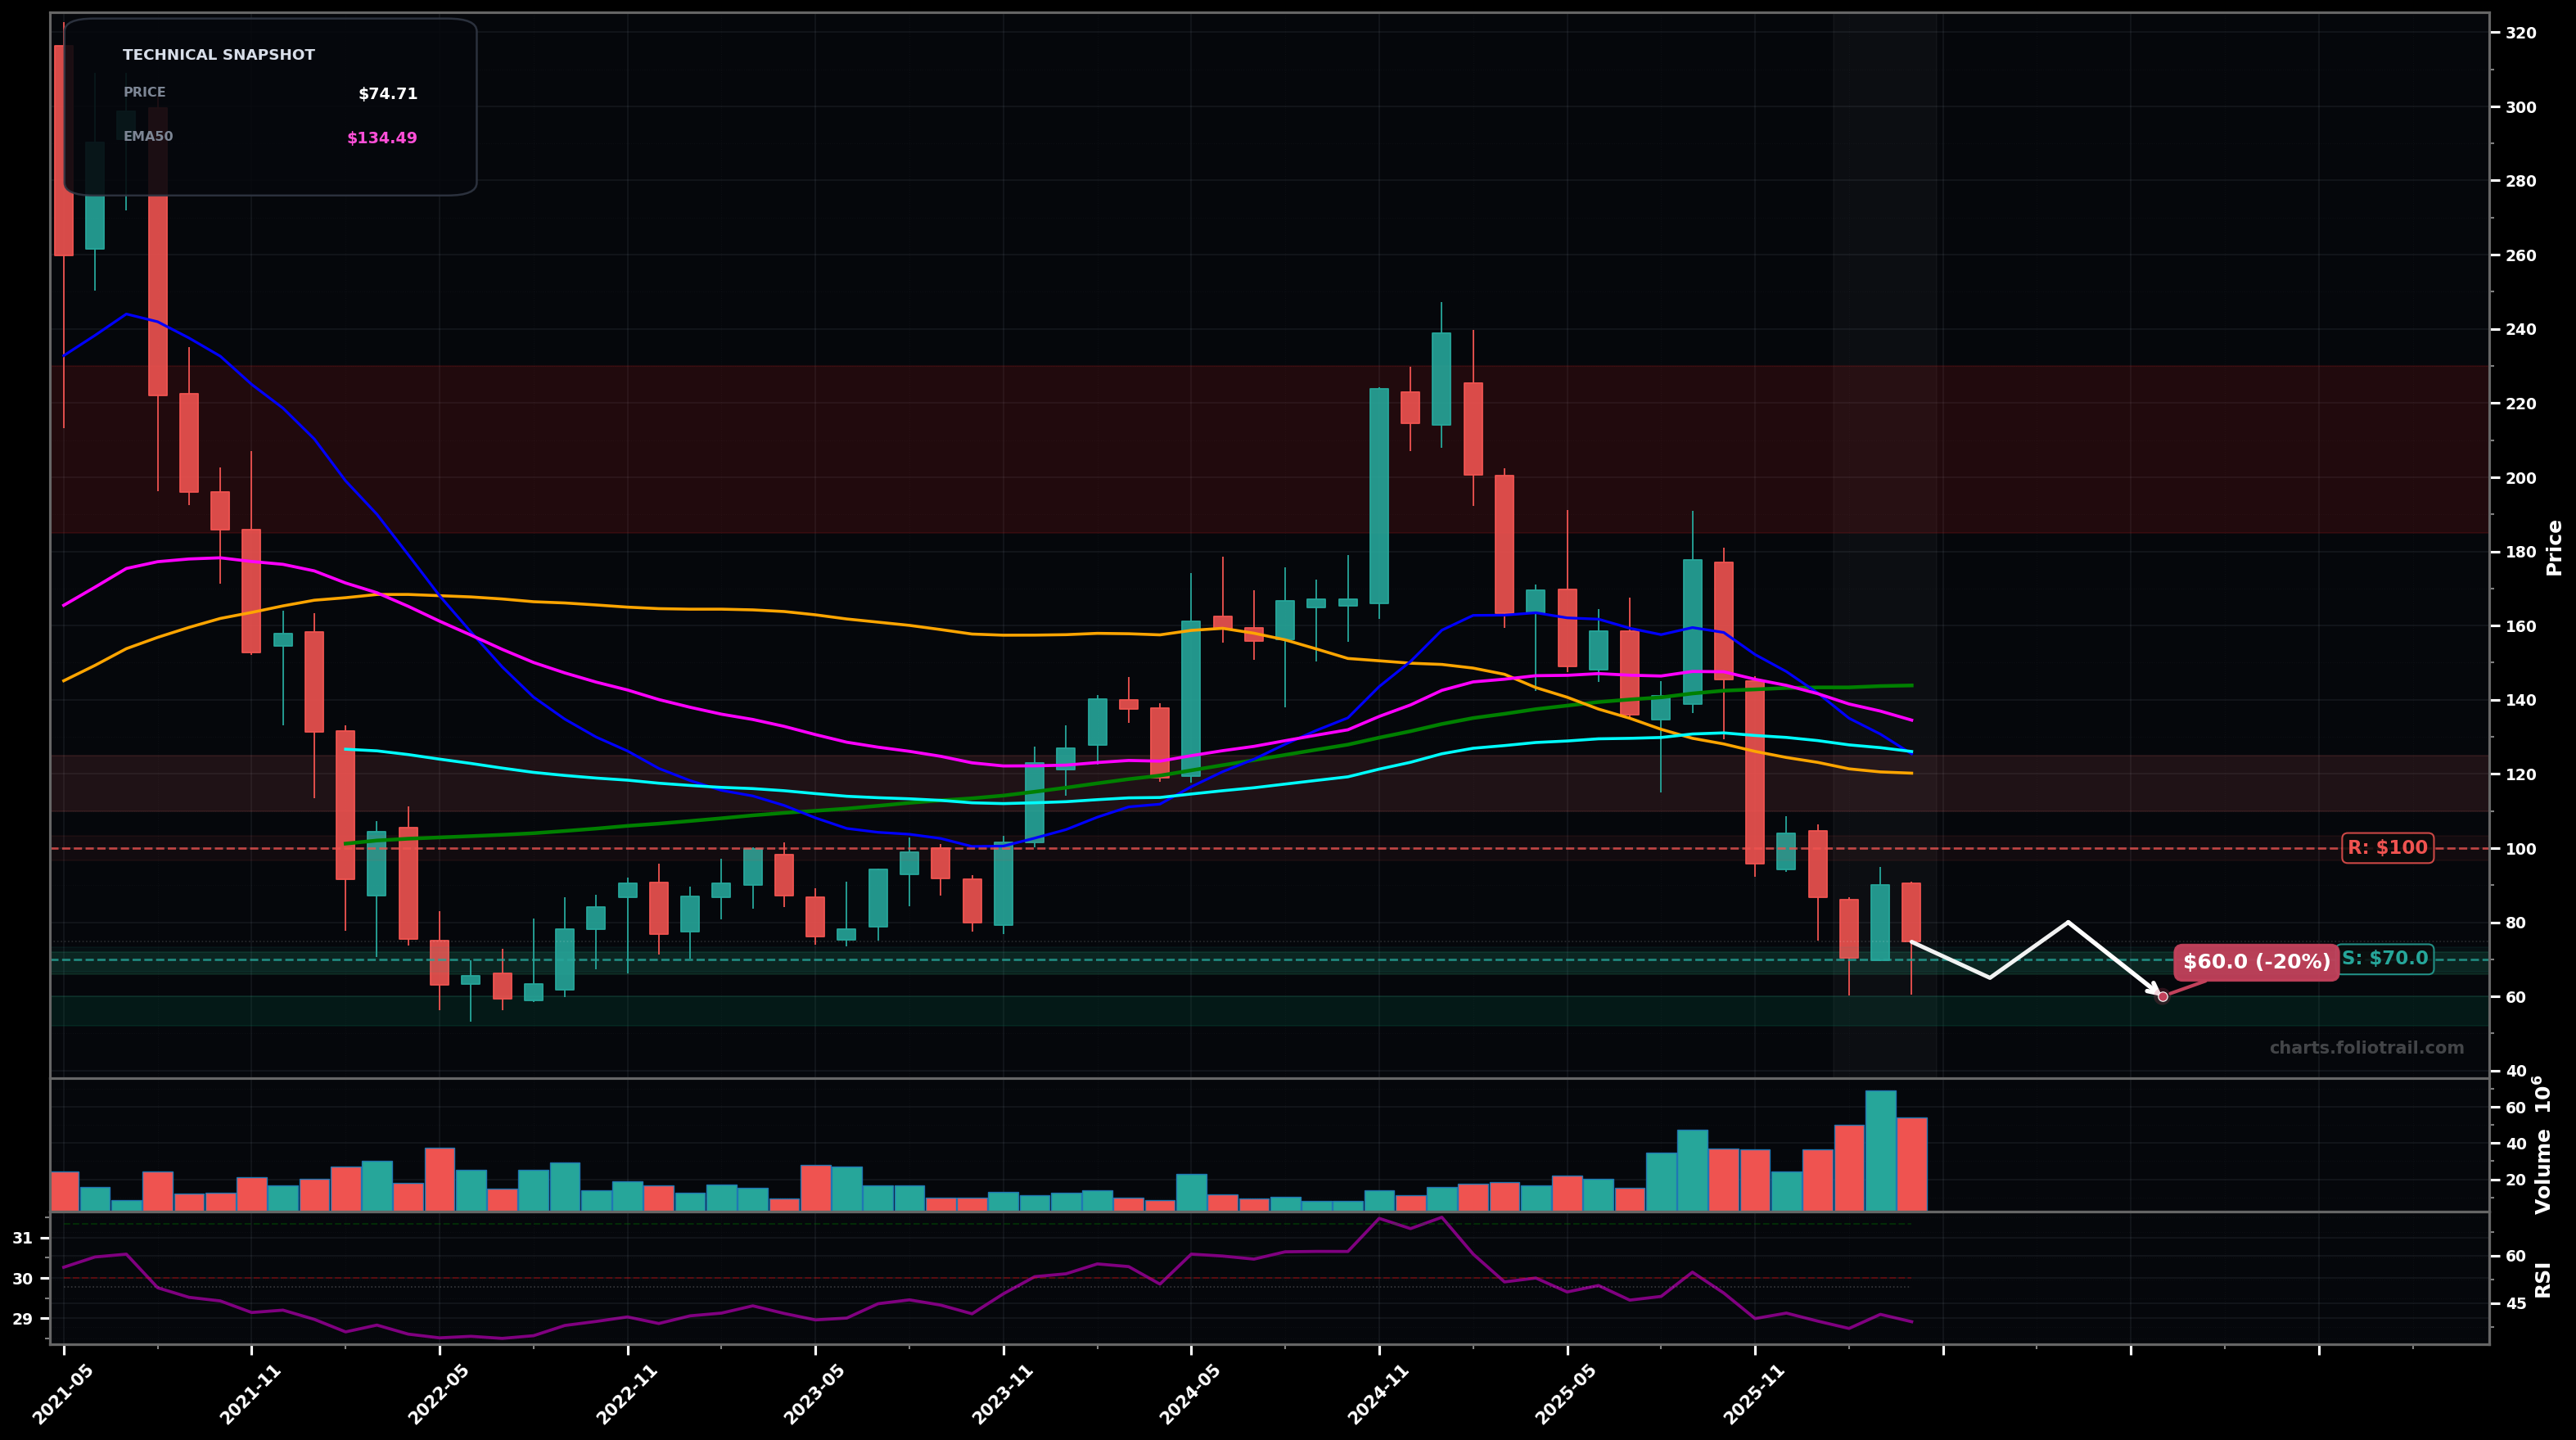
As of April 30, 2026, WIX (Wix.com Ltd.) is in a falling knife state on the monthly chart, with a confidence level of 78%. Key support is at $70.0 and key resistance at $100. Monthly price is in a sharp selloff with a string of LH/LL swings; last close around $74.71 is far below all key MAs and volume expanded on the breakdown.
Bearish continuation: price chops briefly then breaks $70 support, probing the prior base area near $60 before any meaningful rebound.
Relief rally / mean-reversion: a failed breakdown or undercut-and-rally lifts price back toward the broken support zone, but sellers show up near the falling MA band.
Monthly close below $70.00 (followed by another close holding below $70.00)
Monthly close back above $100.00
Staged bids around the $70 pivot and the 2022 swing-low zone (~$60); heavy add only if capitulation flushes into the next historical support pocket.
Trim into the first major supply/failed-support zone ($110–$125), then into the EMA50/EMA100/SMA50 cluster area ($135–$160); fully exit if price revisits the prior distribution/top region ($185+).
As of April 30, 2026, WIX (Wix.com Ltd.) is in a falling knife state on the monthly chart with 78% confidence. Monthly price is in a sharp selloff with a string of LH/LL swings; last close around $74.71 is far below all key MAs and volume expanded on the breakdown.
On the monthly timeframe, WIX has key support at $70.0 and key resistance at $100. The most likely scenario (bearish) targets $65.0 and $60.0, with a revert level at $80.0.
WIX (Wix.com Ltd.) is currently classified as falling knife on the monthly chart, with 78% confidence. Confirmation requires: Monthly close below $70.00 (followed by another close holding below $70.00) This would be invalidated by: Monthly close back above $100.00
The most likely scenario (bearish) targets $65.0 and $60.0, with a revert level at $80.0. The alternative scenario (bullish) targets $90.0 and $110.
Multi-layer AI agents analyse 200+ stocks across daily, weekly, and monthly timeframes — producing market state classifications, price scenarios with targets, and position entry/exit levels. Daily charts updated every trading day at 6 PM ET. Weekly charts refresh Fridays. Monthly charts refresh on the last trading day of each month. No paywall. No sign-up required.
Built by Foliotrail.
All content on this website — including charts, analysis, price targets, support/resistance levels, and position zones — is generated entirely by AI and provided for educational and informational purposes only.
This is not financial advice. NEXUSNOIR VENTURES SL (the operator of this website) is not a registered investment adviser or broker-dealer. You should not make investment decisions based solely on this information. Always do your own research and consult a qualified financial advisor.
By continuing, you acknowledge that you have read and agree to our full disclaimer & terms of use and privacy policy.