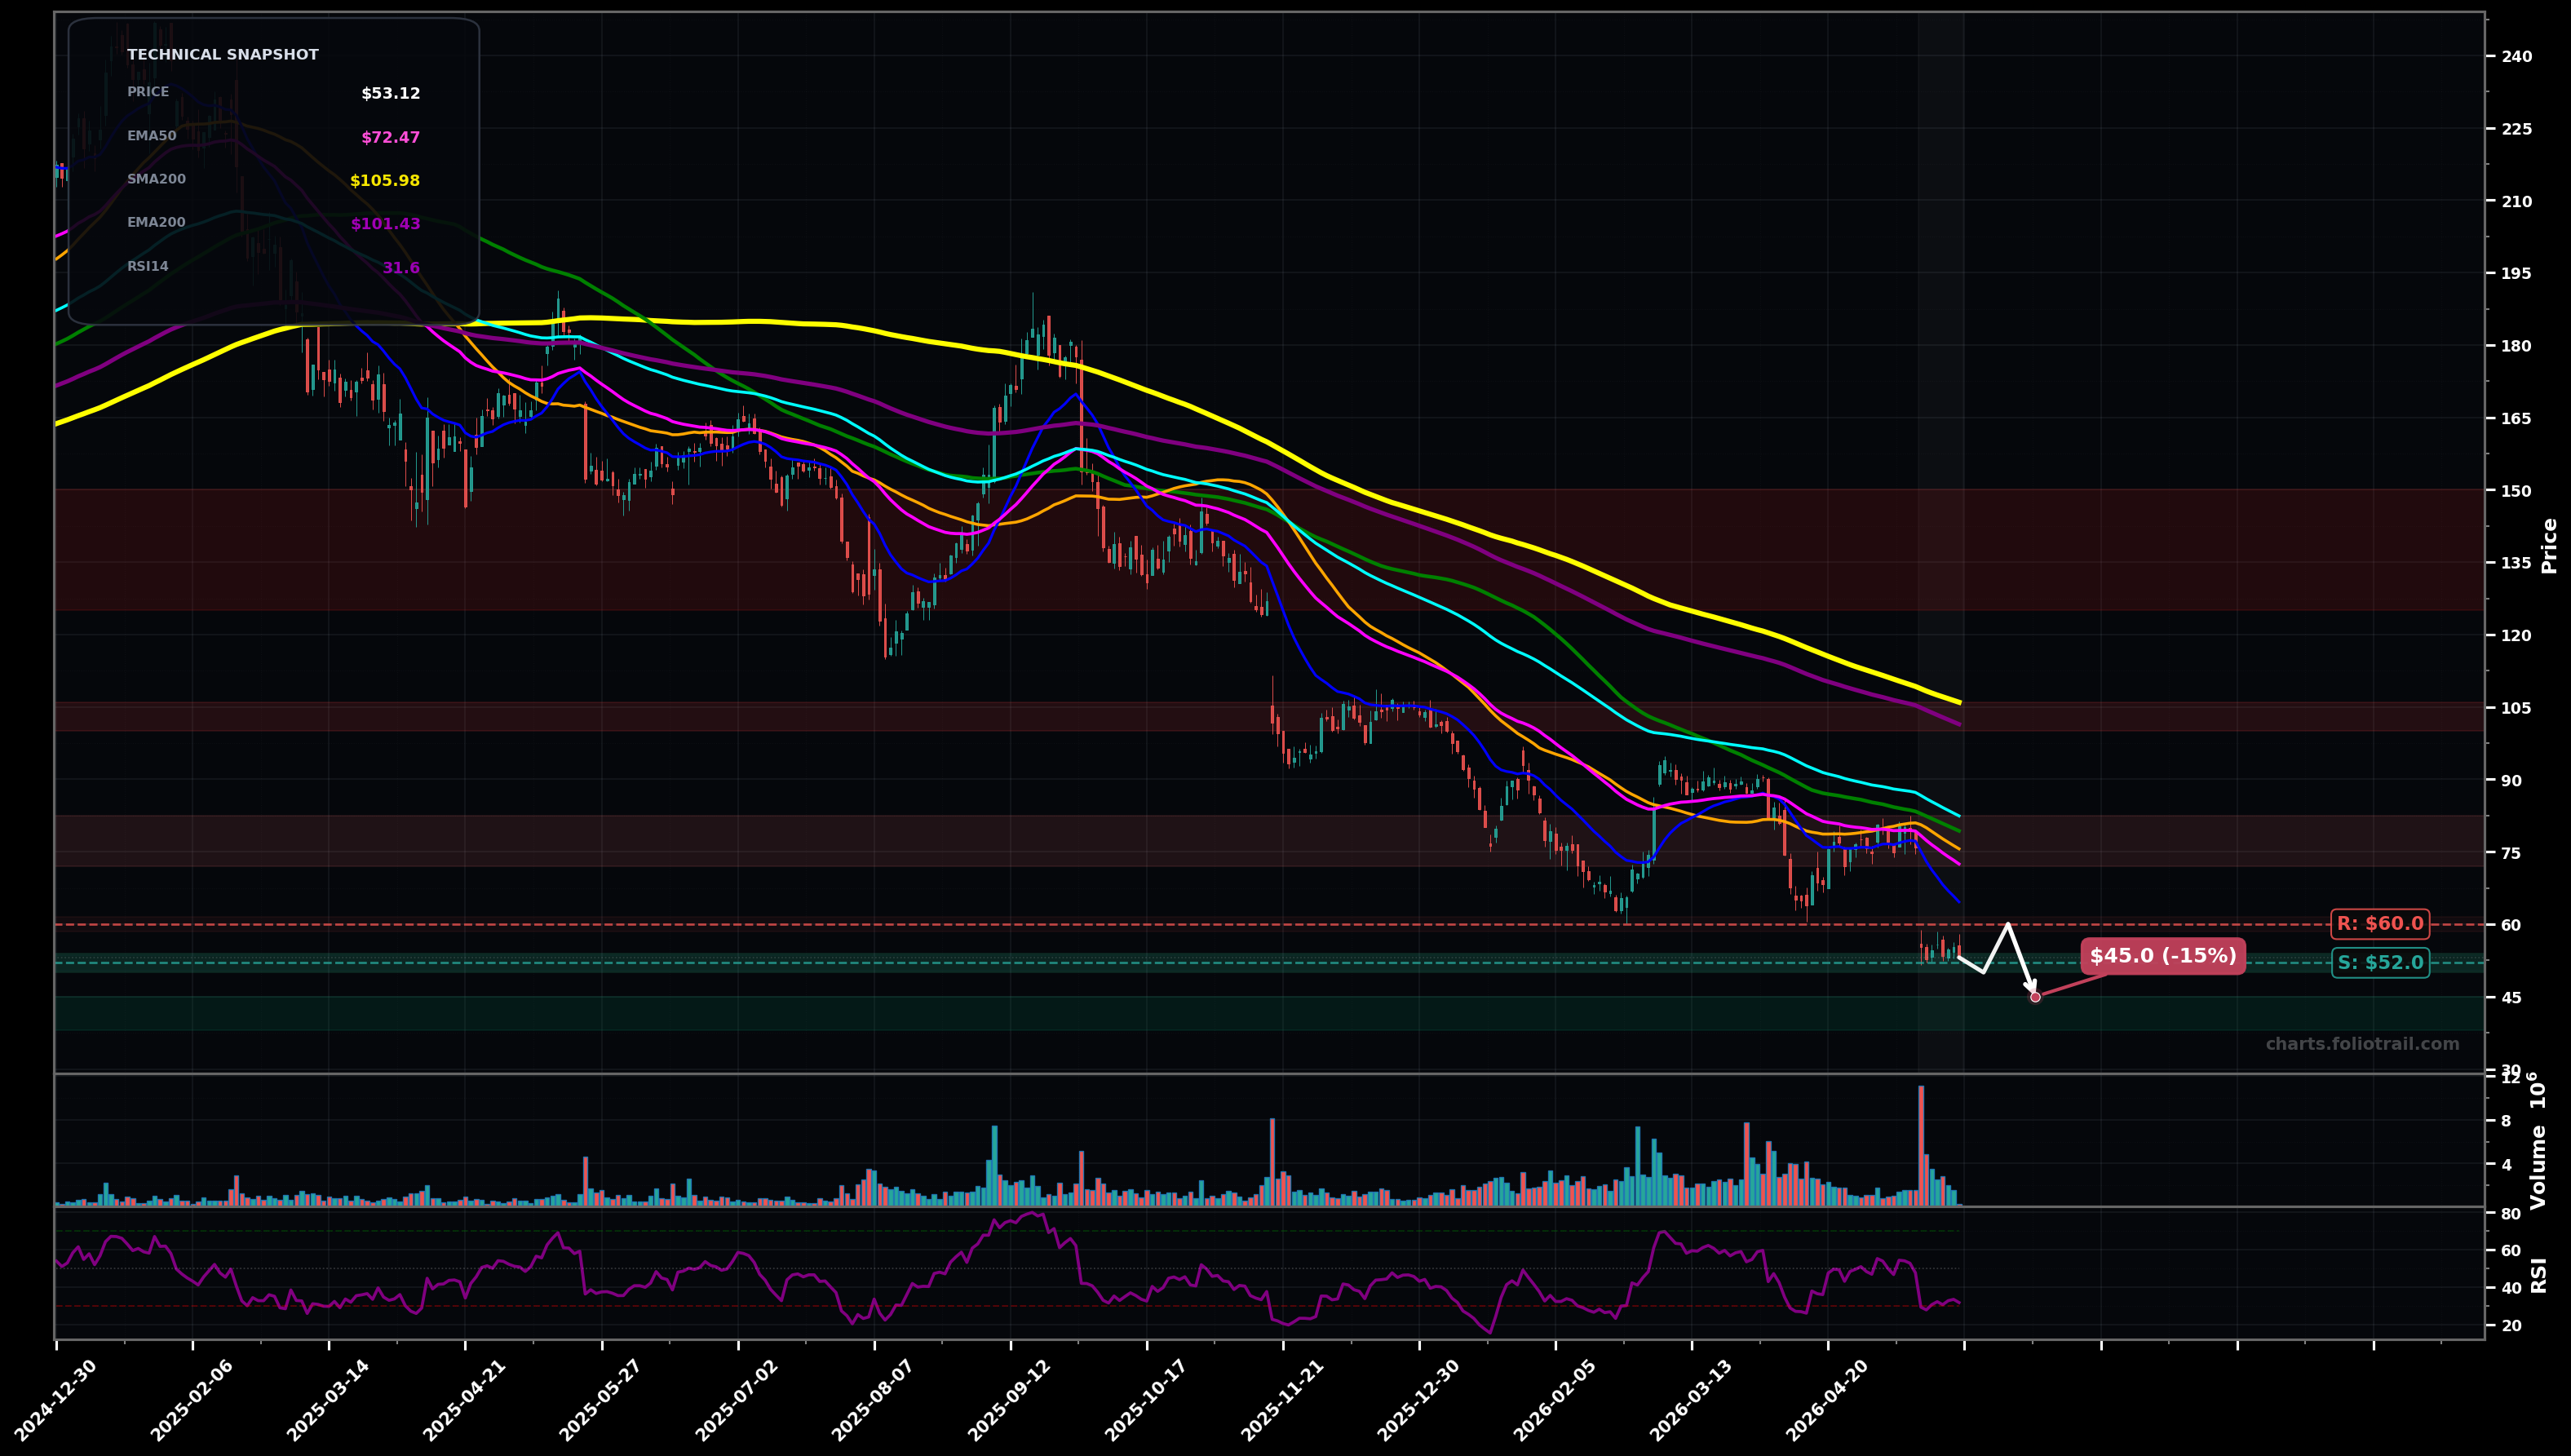
As of May 22, 2026, WIX (Wix.com Ltd.) is in a falling knife state on the daily chart, with a confidence level of 74%. Key support is at $52.0 and key resistance at $60.0. Price at ~$53.12 after a sharp breakdown from the ~$70-$80 shelf; all key MAs overhead and sloping down; RSI ~31.65 (near-oversold).
Bearish continuation: minor dead-cat bounce fails into $60-$65 (EMA20/old support) then sellers press to new lows; Elliott view: still in a late impulse leg down (wave 5) with only brief corrective bounces.
Oversold rebound / bottoming attempt: price defends $52-$50, forms a higher low and squeezes into the first MA cluster; Fibonacci-style retrace of the last leg down targets the ~$64-$72 zone before heavy supply returns.
Daily close below $52.00 (break of current swing-low area) with follow-through.
2+ daily closes back above $64.60 (reclaim of EMA20 area) holding.
Knife-catching risk is high; start near current swing-low support, add on flush into next downside extension, heavy-add only on capitulation-style discount well below broken base.
Trim into major moving-average resistance zones (EMA50/EMA100 first, then SMA200/EMA200); full exit only if a multi-year mean-reversion overshoots well above long-term MAs.
As of May 22, 2026, WIX (Wix.com Ltd.) is in a falling knife state on the daily chart with 74% confidence. Price at ~$53.12 after a sharp breakdown from the ~$70-$80 shelf; all key MAs overhead and sloping down; RSI ~31.65 (near-oversold).
On the daily timeframe, WIX has key support at $52.0 and key resistance at $60.0. The most likely scenario (bearish) targets $50.0 and $45.0, with a revert level at $60.0.
WIX (Wix.com Ltd.) is currently classified as falling knife on the daily chart, with 74% confidence. Confirmation requires: Daily close below $52.00 (break of current swing-low area) with follow-through. This would be invalidated by: 2+ daily closes back above $64.60 (reclaim of EMA20 area) holding.
The most likely scenario (bearish) targets $50.0 and $45.0, with a revert level at $60.0. The alternative scenario (bullish) targets $64.6 and $72.5.
Multi-layer AI agents analyse 200+ stocks across daily, weekly, and monthly timeframes — producing market state classifications, price scenarios with targets, and position entry/exit levels. Daily charts updated every trading day at 6 PM ET. Weekly charts refresh Fridays. Monthly charts refresh on the last trading day of each month. No paywall. No sign-up required.
Built by Foliotrail.
All content on this website — including charts, analysis, price targets, support/resistance levels, and position zones — is generated entirely by AI and provided for educational and informational purposes only.
This is not financial advice. NEXUSNOIR VENTURES SL (the operator of this website) is not a registered investment adviser or broker-dealer. You should not make investment decisions based solely on this information. Always do your own research and consult a qualified financial advisor.
By continuing, you acknowledge that you have read and agree to our full disclaimer & terms of use and privacy policy.