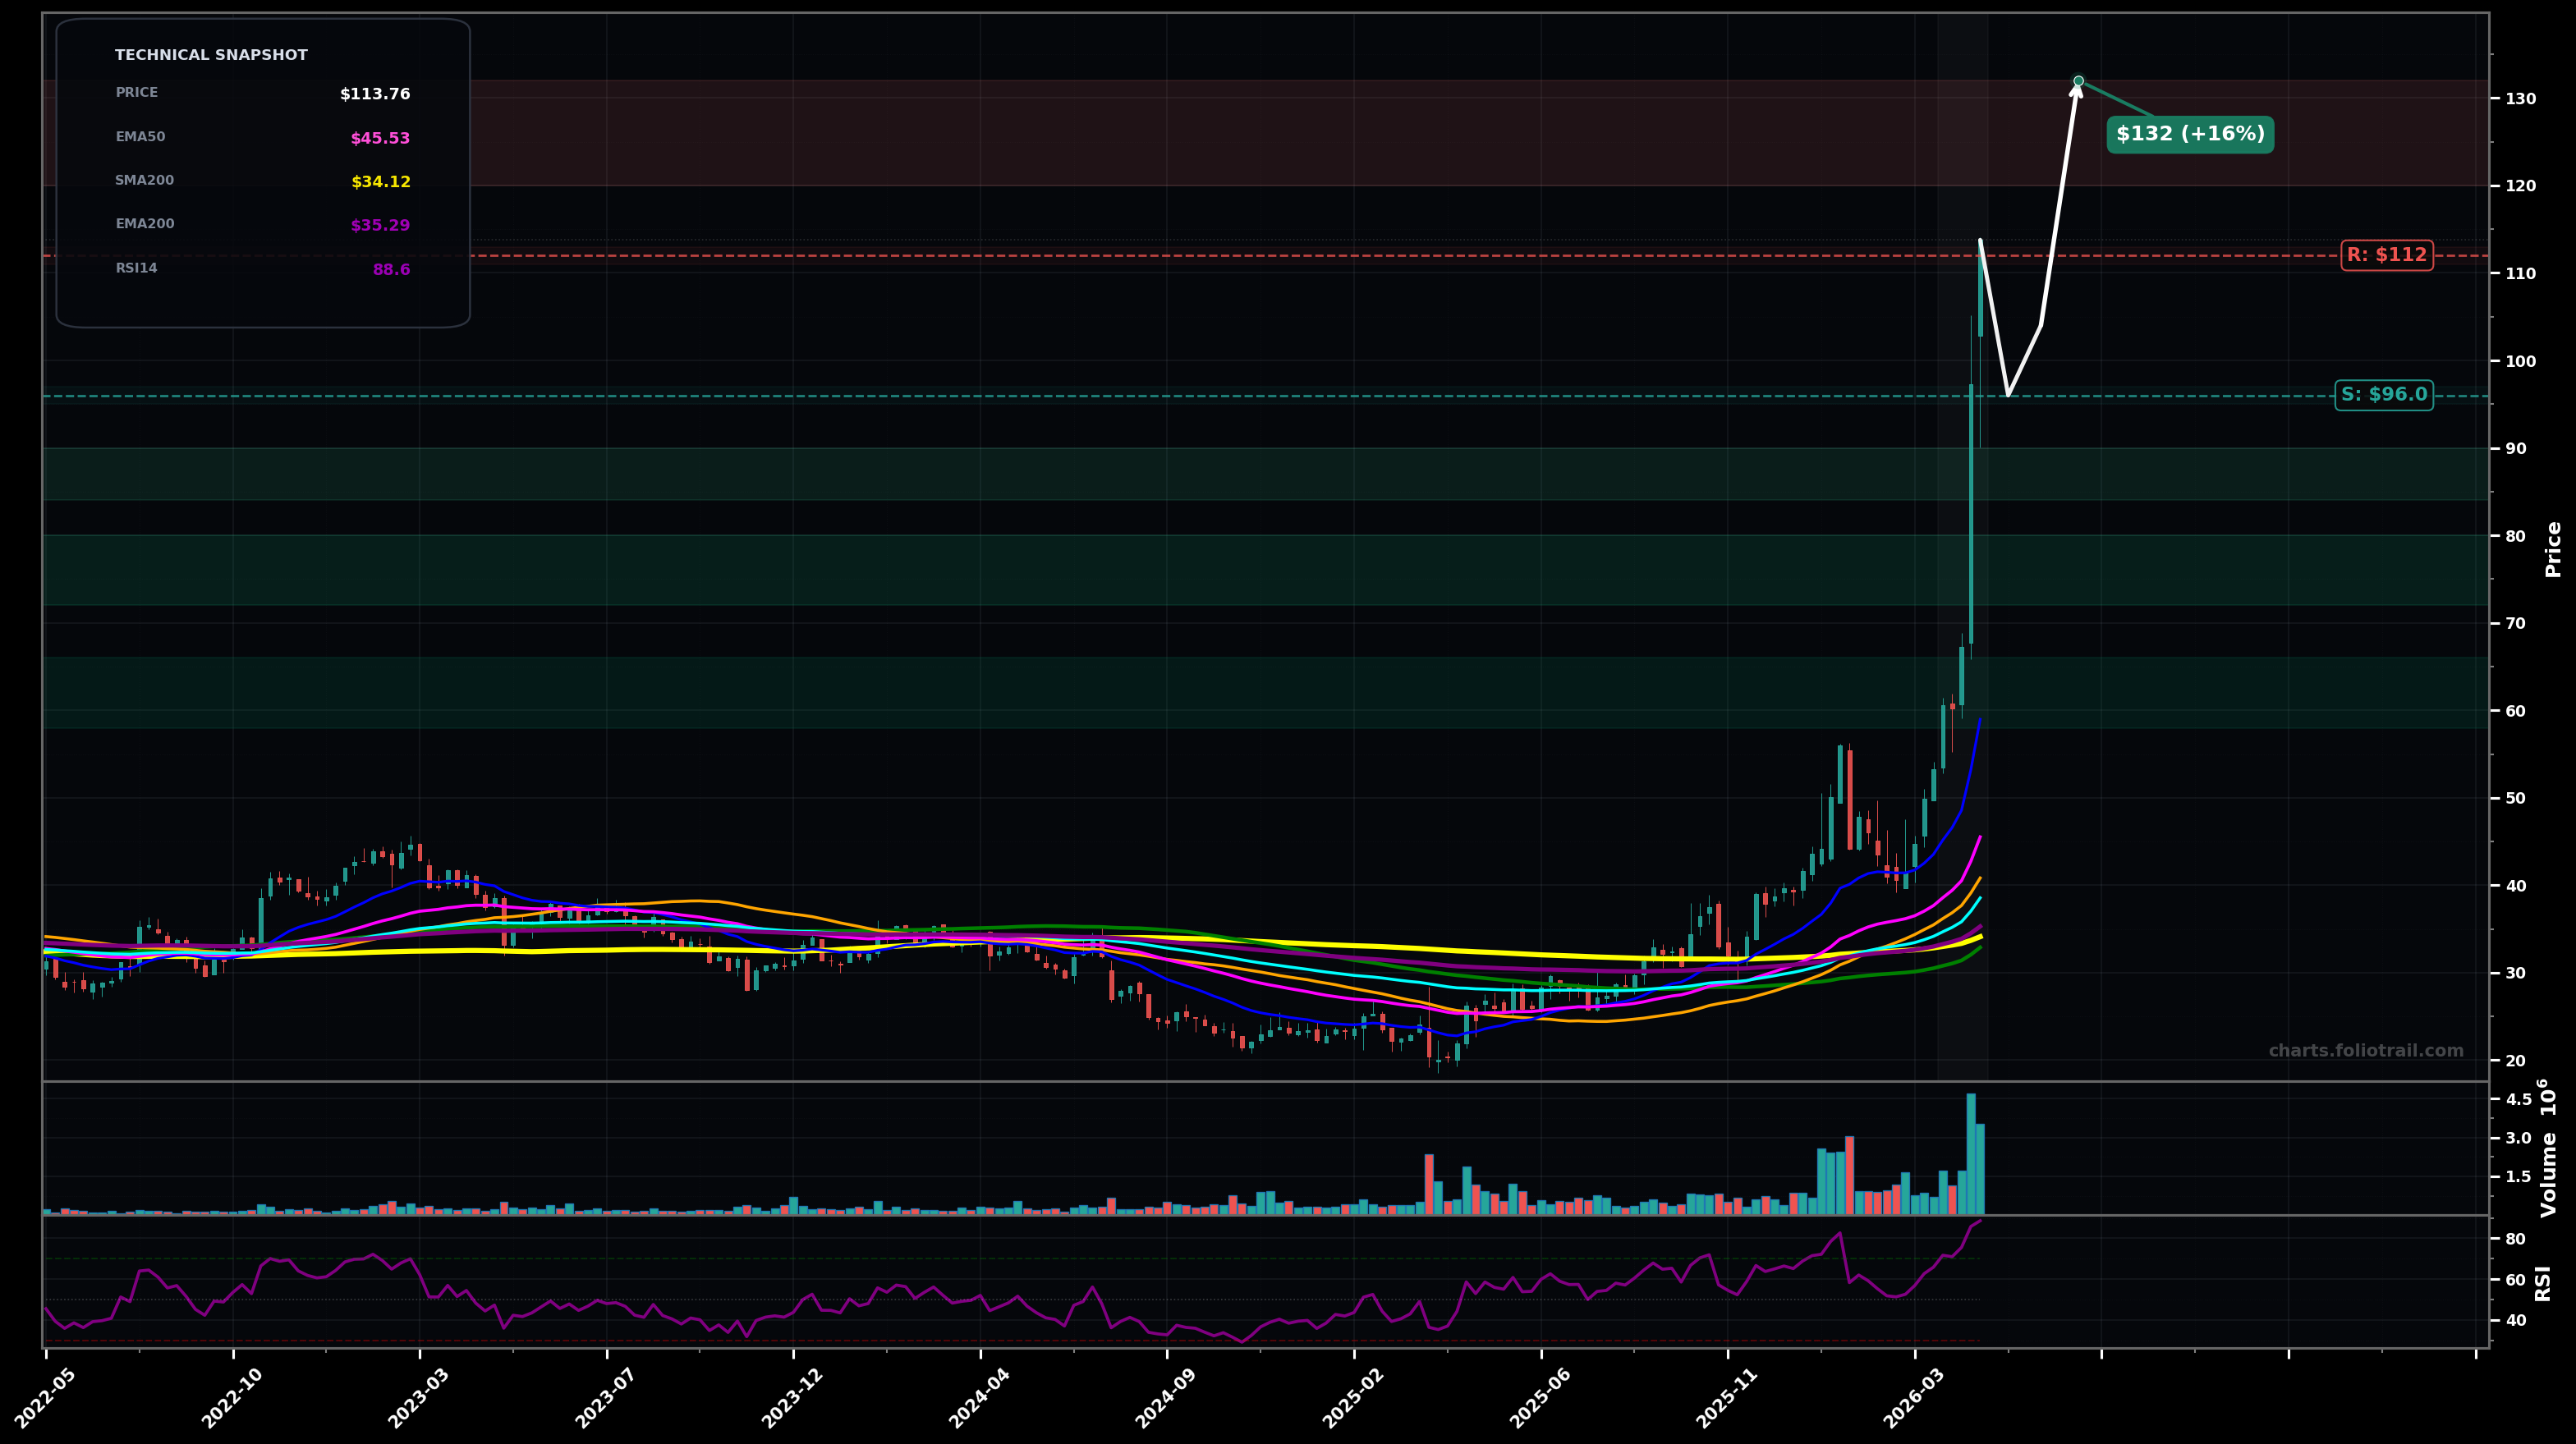
As of May 22, 2026, VPG (Vishay Precision Group Inc.) is in a parabolic state on the weekly chart, with a confidence level of 78%. Key support is at $96.0 and key resistance at $112. Vertical weekly breakout to new highs with expanding volume; price ($113.76) extremely stretched above all EMAs/SMAs and RSI (~88.6) overheated.
Bullish continuation but with a likely sharp pullback/basing first: price mean-reverts toward prior breakout zone, then attempts another push higher (Elliott: extended wave 3/5 behavior; Fib: pullback often to ~0.236–0.382 of the most recent impulse). Rough probability ~60%.
Blow-off top and larger correction: failure to hold recent breakout causes a faster unwind toward the rising short-term trend/EMA20 area, potentially forming a multi-week range before any new highs (Elliott: wave 5 truncation/ending diagonal risk; Fib: deeper 0.382–0.618 retrace). Rough probability ~40%.
Weekly close holding above $104 would confirm continued parabolic trend (momentum follow-through).
Weekly close below $96 would invalidate parabolic continuation and favor a deeper mean-reversion leg.
Prefer buying pullbacks into prior breakout/weekly demand ($84–$90), then deeper Fib retrace zones ($72–$80); heavy add only if a full mean reversion toward the rising EMA20/EMA50 region occurs ($58–$66).
With price already parabolic and RSI extreme, trims are favored into further upside extensions (psychological + measured-move zones); progressively heavier de-risking as extension grows and odds of multi-week/month mean-reversion increase.
As of May 22, 2026, VPG (Vishay Precision Group Inc.) is in a parabolic state on the weekly chart with 78% confidence. Vertical weekly breakout to new highs with expanding volume; price ($113.76) extremely stretched above all EMAs/SMAs and RSI (~88.6) overheated.
On the weekly timeframe, VPG has key support at $96.0 and key resistance at $112. The most likely scenario (bullish) targets $96.0 and $132, with a revert level at $104.
VPG (Vishay Precision Group Inc.) is currently classified as parabolic on the weekly chart, with 78% confidence. Confirmation requires: Weekly close holding above $104 would confirm continued parabolic trend (momentum follow-through). This would be invalidated by: Weekly close below $96 would invalidate parabolic continuation and favor a deeper mean-reversion leg.
The most likely scenario (bullish) targets $96.0 and $132, with a revert level at $104. The alternative scenario (bearish) targets $88.0 and $72.0.
Multi-layer AI agents analyse 200+ stocks across daily, weekly, and monthly timeframes — producing market state classifications, price scenarios with targets, and position entry/exit levels. Daily charts updated every trading day at 6 PM ET. Weekly charts refresh Fridays. Monthly charts refresh on the last trading day of each month. No paywall. No sign-up required.
Built by Foliotrail.
All content on this website — including charts, analysis, price targets, support/resistance levels, and position zones — is generated entirely by AI and provided for educational and informational purposes only.
This is not financial advice. NEXUSNOIR VENTURES SL (the operator of this website) is not a registered investment adviser or broker-dealer. You should not make investment decisions based solely on this information. Always do your own research and consult a qualified financial advisor.
By continuing, you acknowledge that you have read and agree to our full disclaimer & terms of use and privacy policy.