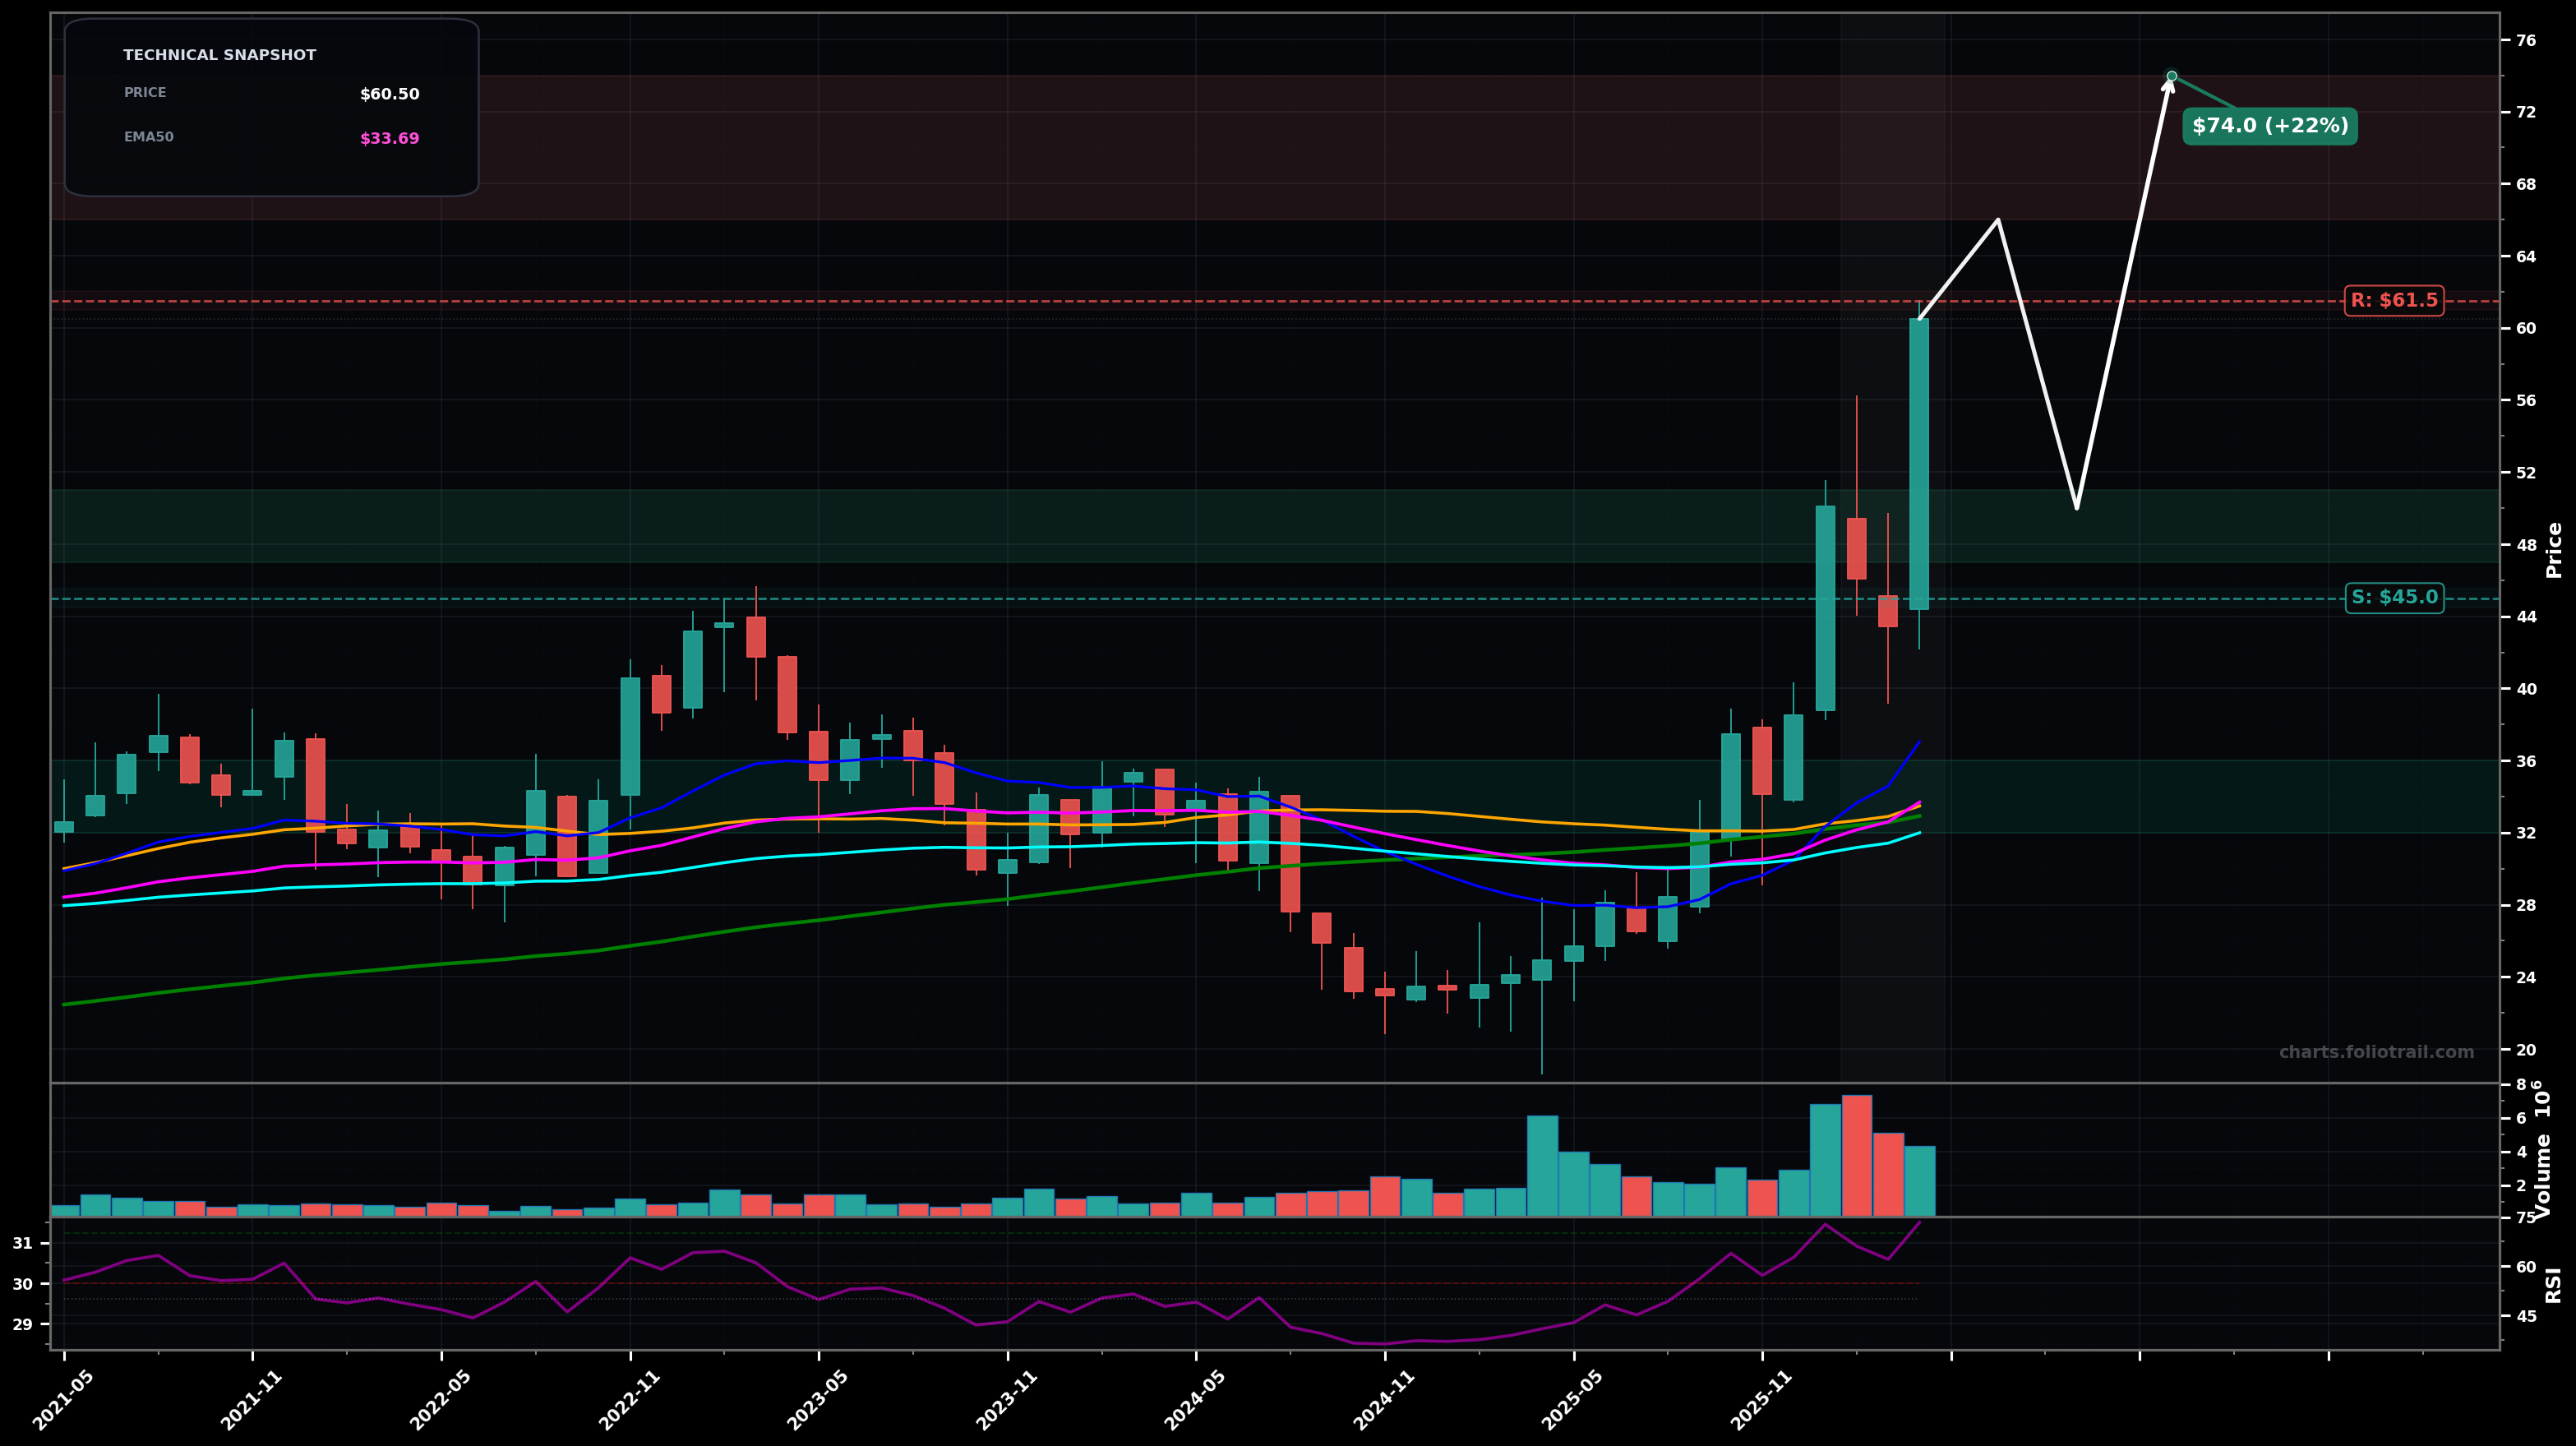
As of April 30, 2026, VPG (Vishay Precision Group Inc.) is in a parabolic state on the monthly chart, with a confidence level of 72%. Key support is at $45.0 and key resistance at $61.5. Monthly breakout to new swing highs with a large green expansion candle; price $60.50 far above clustered MAs; RSI(14) ~73 (overbought).
Bullish continuation: brief consolidation/pullback then push to a Fibonacci extension zone; Elliott view = extended Wave 3 with a short Wave 4 pause before one more thrust.
Mean-reversion: parabolic move fades into a deeper Wave 4 correction toward prior breakout structure and rising MAs before trend decides; volatility stays elevated.
2 monthly closes above $61.00 while holding above $50.00 on pullbacks
Monthly close below $45.00 (breaks the most recent higher low / impulse base area)
Use the breakout retest ($47-$51) first; add on deeper pullback into prior resistance/structure ($39-$44); heavy add near MA cluster/mean reversion zone around EMA50/SMA50/SMA100 (~$32-$36).
Trim into extension targets (likely Wave 5/extension) as price gets increasingly stretched above EMA50/EMA100; close into extreme multi-year extension zones where reversals typically occur.
As of April 30, 2026, VPG (Vishay Precision Group Inc.) is in a parabolic state on the monthly chart with 72% confidence. Monthly breakout to new swing highs with a large green expansion candle; price $60.50 far above clustered MAs; RSI(14) ~73 (overbought).
On the monthly timeframe, VPG has key support at $45.0 and key resistance at $61.5. The most likely scenario (bullish) targets $66.0 and $74.0, with a revert level at $50.0.
VPG (Vishay Precision Group Inc.) is currently classified as parabolic on the monthly chart, with 72% confidence. Confirmation requires: 2 monthly closes above $61.00 while holding above $50.00 on pullbacks This would be invalidated by: Monthly close below $45.00 (breaks the most recent higher low / impulse base area)
The most likely scenario (bullish) targets $66.0 and $74.0, with a revert level at $50.0. The alternative scenario (bearish) targets $50.0 and $36.0.
Multi-layer AI agents analyse 200+ stocks across daily, weekly, and monthly timeframes — producing market state classifications, price scenarios with targets, and position entry/exit levels. Daily charts updated every trading day at 6 PM ET. Weekly charts refresh Fridays. Monthly charts refresh on the last trading day of each month. No paywall. No sign-up required.
Built by Foliotrail.
All content on this website — including charts, analysis, price targets, support/resistance levels, and position zones — is generated entirely by AI and provided for educational and informational purposes only.
This is not financial advice. NEXUSNOIR VENTURES SL (the operator of this website) is not a registered investment adviser or broker-dealer. You should not make investment decisions based solely on this information. Always do your own research and consult a qualified financial advisor.
By continuing, you acknowledge that you have read and agree to our full disclaimer & terms of use and privacy policy.