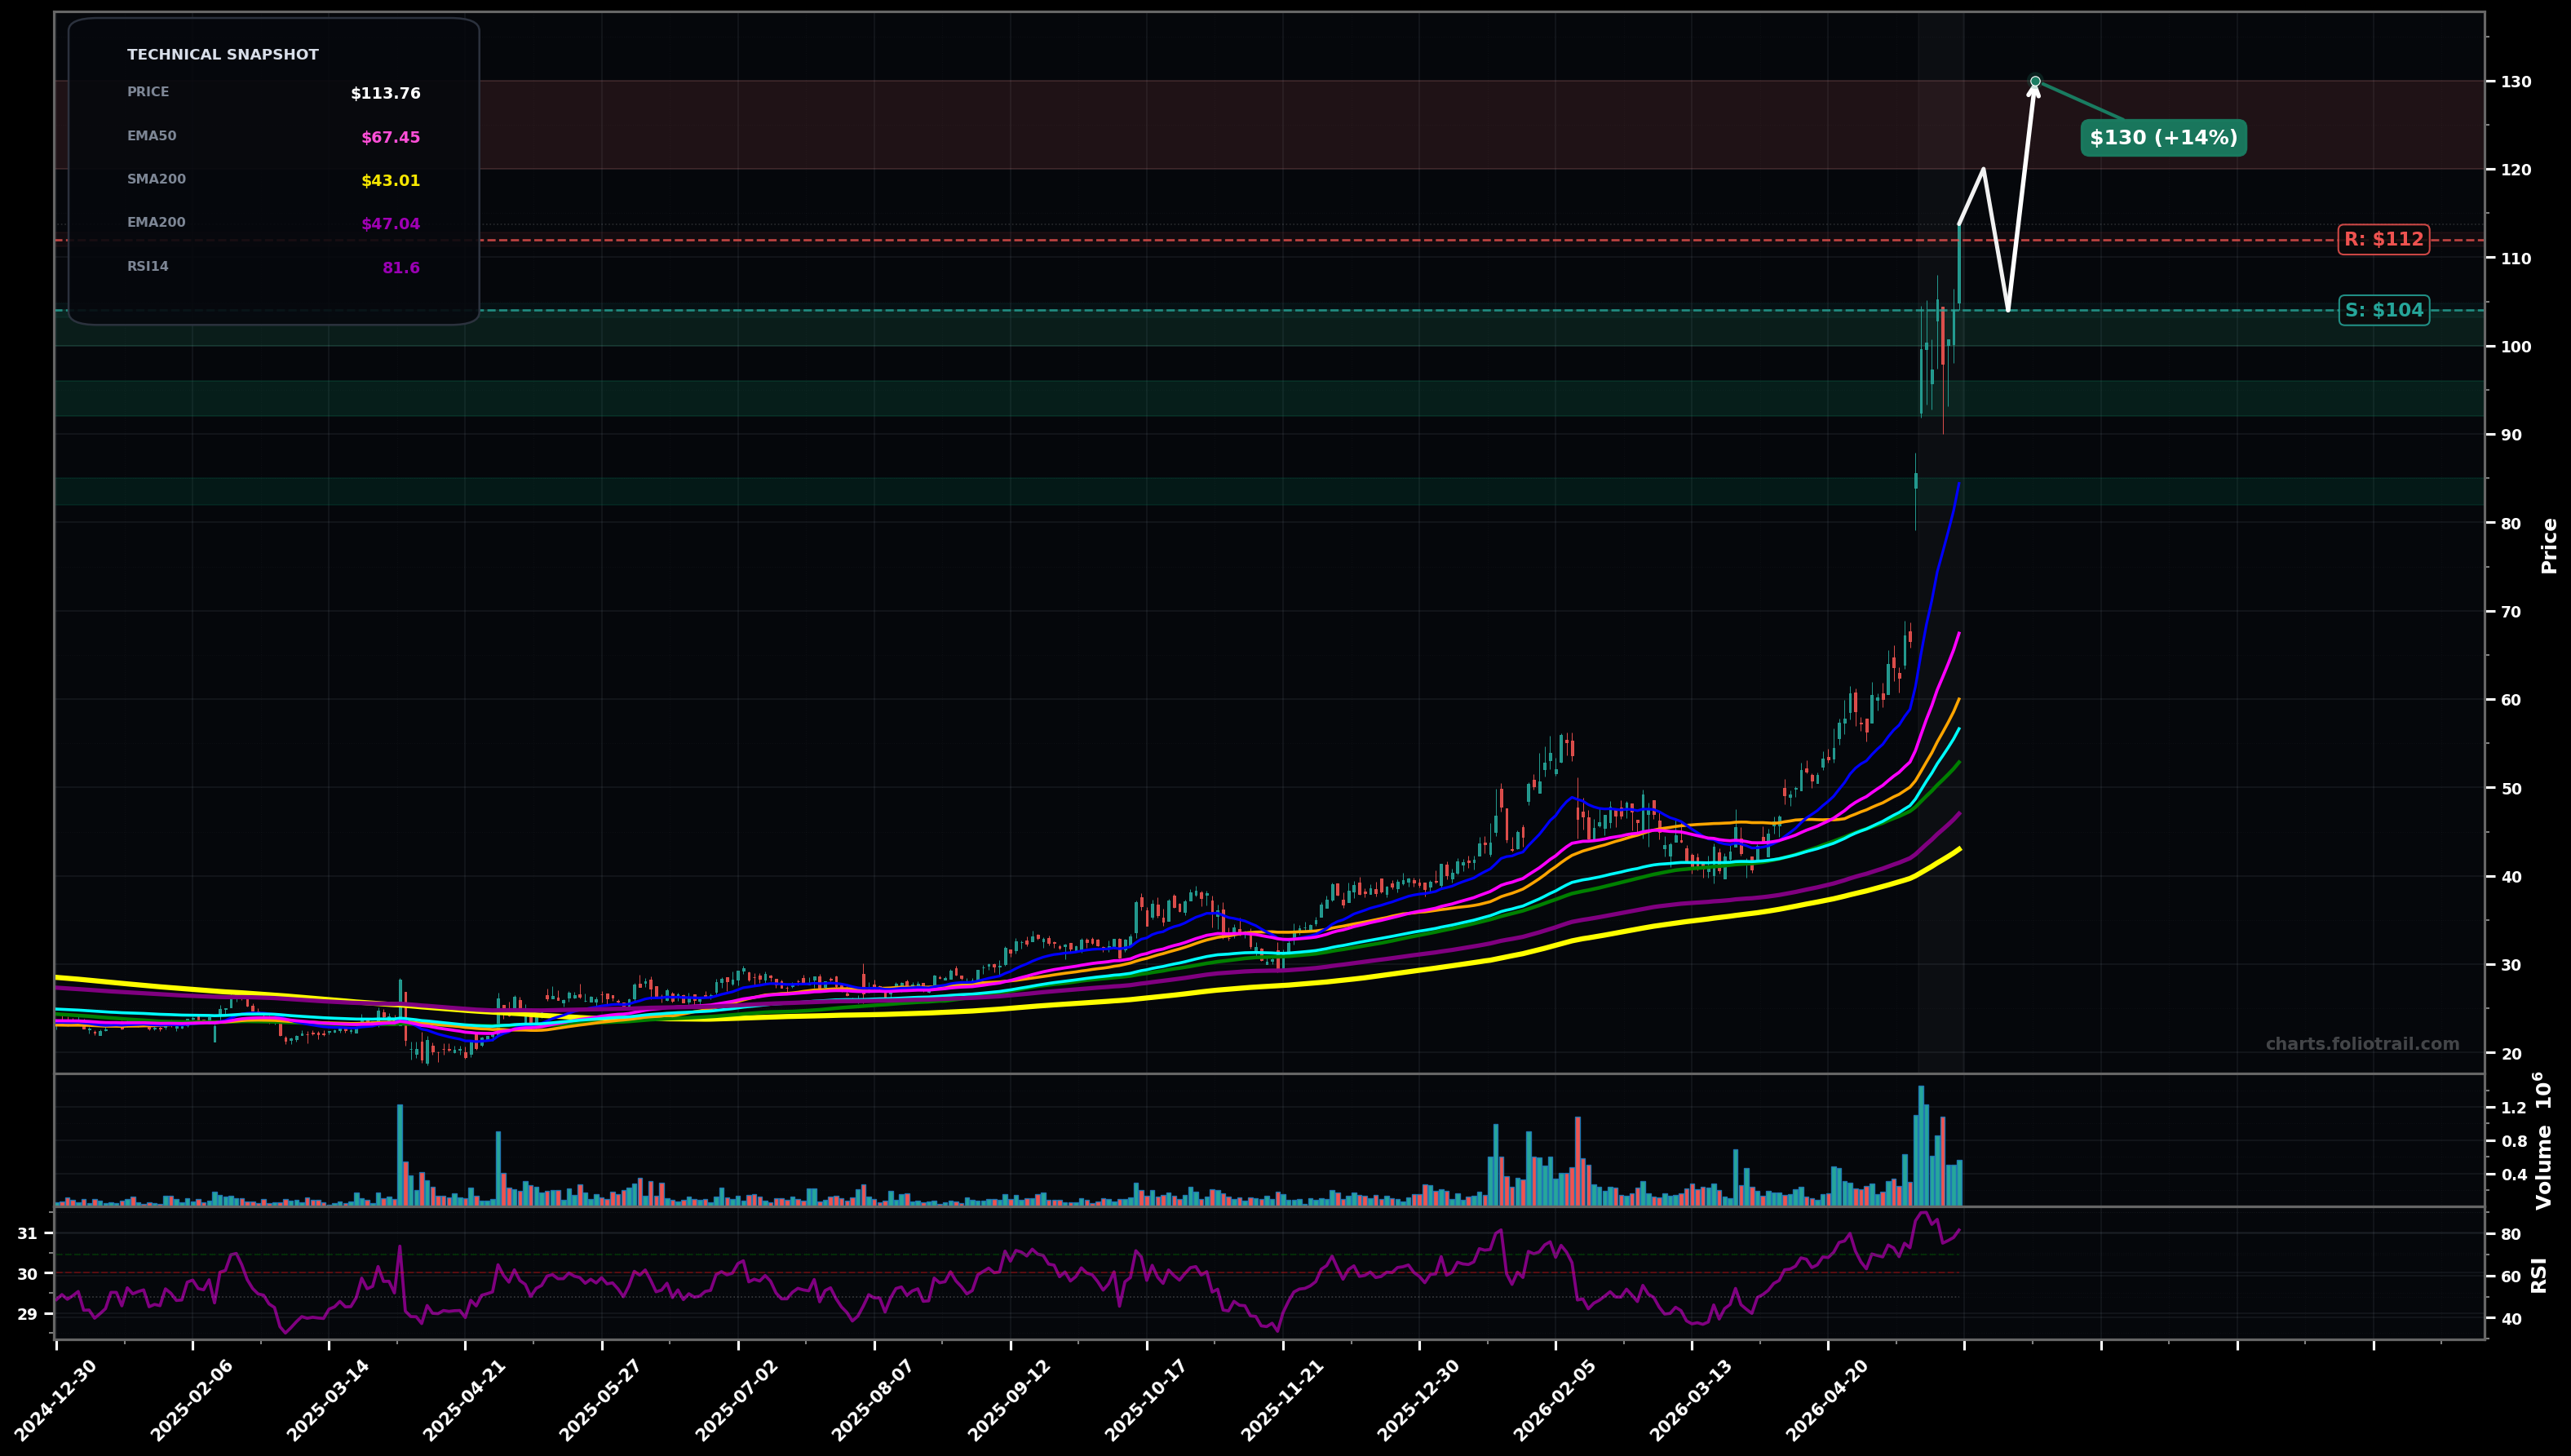
As of May 22, 2026, VPG (Vishay Precision Group Inc.) is in a parabolic state on the daily chart, with a confidence level of 76%. Key support is at $104 and key resistance at $112. Strong momentum breakout to new highs; price $113.76 is very extended above all key MAs with RSI-14 $81.62 (overbought) and rising volume.
Parabolic continuation with brief consolidation; buyers defend the breakout area and push to the next round-number extensions (Elliott: likely late Wave 3 or Wave 5 extension; expect sharp but shallow pullbacks).
Mean-reversion pullback after an exhaustion push; price retraces toward rising fast MAs (EMA20 area) then attempts a higher-low base (Elliott: Wave 4-type correction before another attempt up).
Daily close holding above $104.00 (prior breakout zone) for 2+ sessions
Daily close below $96.00 (break back into the breakout base)
Start near reclaimed breakout support (~$104); add on deeper retrace into the breakout range (~$96); heavy add only if a Wave-4 style flush tags the EMA20/structure zone (~$84) while holding a higher low vs the prior swing.
RSI>80 + price massively stretched above EMA50/100/200 implies high reversion risk; trim into psychological extension levels and hold only a core unless the trend keeps building HH/HL with support holds.
As of May 22, 2026, VPG (Vishay Precision Group Inc.) is in a parabolic state on the daily chart with 76% confidence. Strong momentum breakout to new highs; price $113.76 is very extended above all key MAs with RSI-14 $81.62 (overbought) and rising volume.
On the daily timeframe, VPG has key support at $104 and key resistance at $112. The most likely scenario (bullish) targets $120 and $130, with a revert level at $104.
VPG (Vishay Precision Group Inc.) is currently classified as parabolic on the daily chart, with 76% confidence. Confirmation requires: Daily close holding above $104.00 (prior breakout zone) for 2+ sessions This would be invalidated by: Daily close below $96.00 (break back into the breakout base)
The most likely scenario (bullish) targets $120 and $130, with a revert level at $104. The alternative scenario (bearish) targets $96.0 and $84.0.
Multi-layer AI agents analyse 200+ stocks across daily, weekly, and monthly timeframes — producing market state classifications, price scenarios with targets, and position entry/exit levels. Daily charts updated every trading day at 6 PM ET. Weekly charts refresh Fridays. Monthly charts refresh on the last trading day of each month. No paywall. No sign-up required.
Built by Foliotrail.
All content on this website — including charts, analysis, price targets, support/resistance levels, and position zones — is generated entirely by AI and provided for educational and informational purposes only.
This is not financial advice. NEXUSNOIR VENTURES SL (the operator of this website) is not a registered investment adviser or broker-dealer. You should not make investment decisions based solely on this information. Always do your own research and consult a qualified financial advisor.
By continuing, you acknowledge that you have read and agree to our full disclaimer & terms of use and privacy policy.