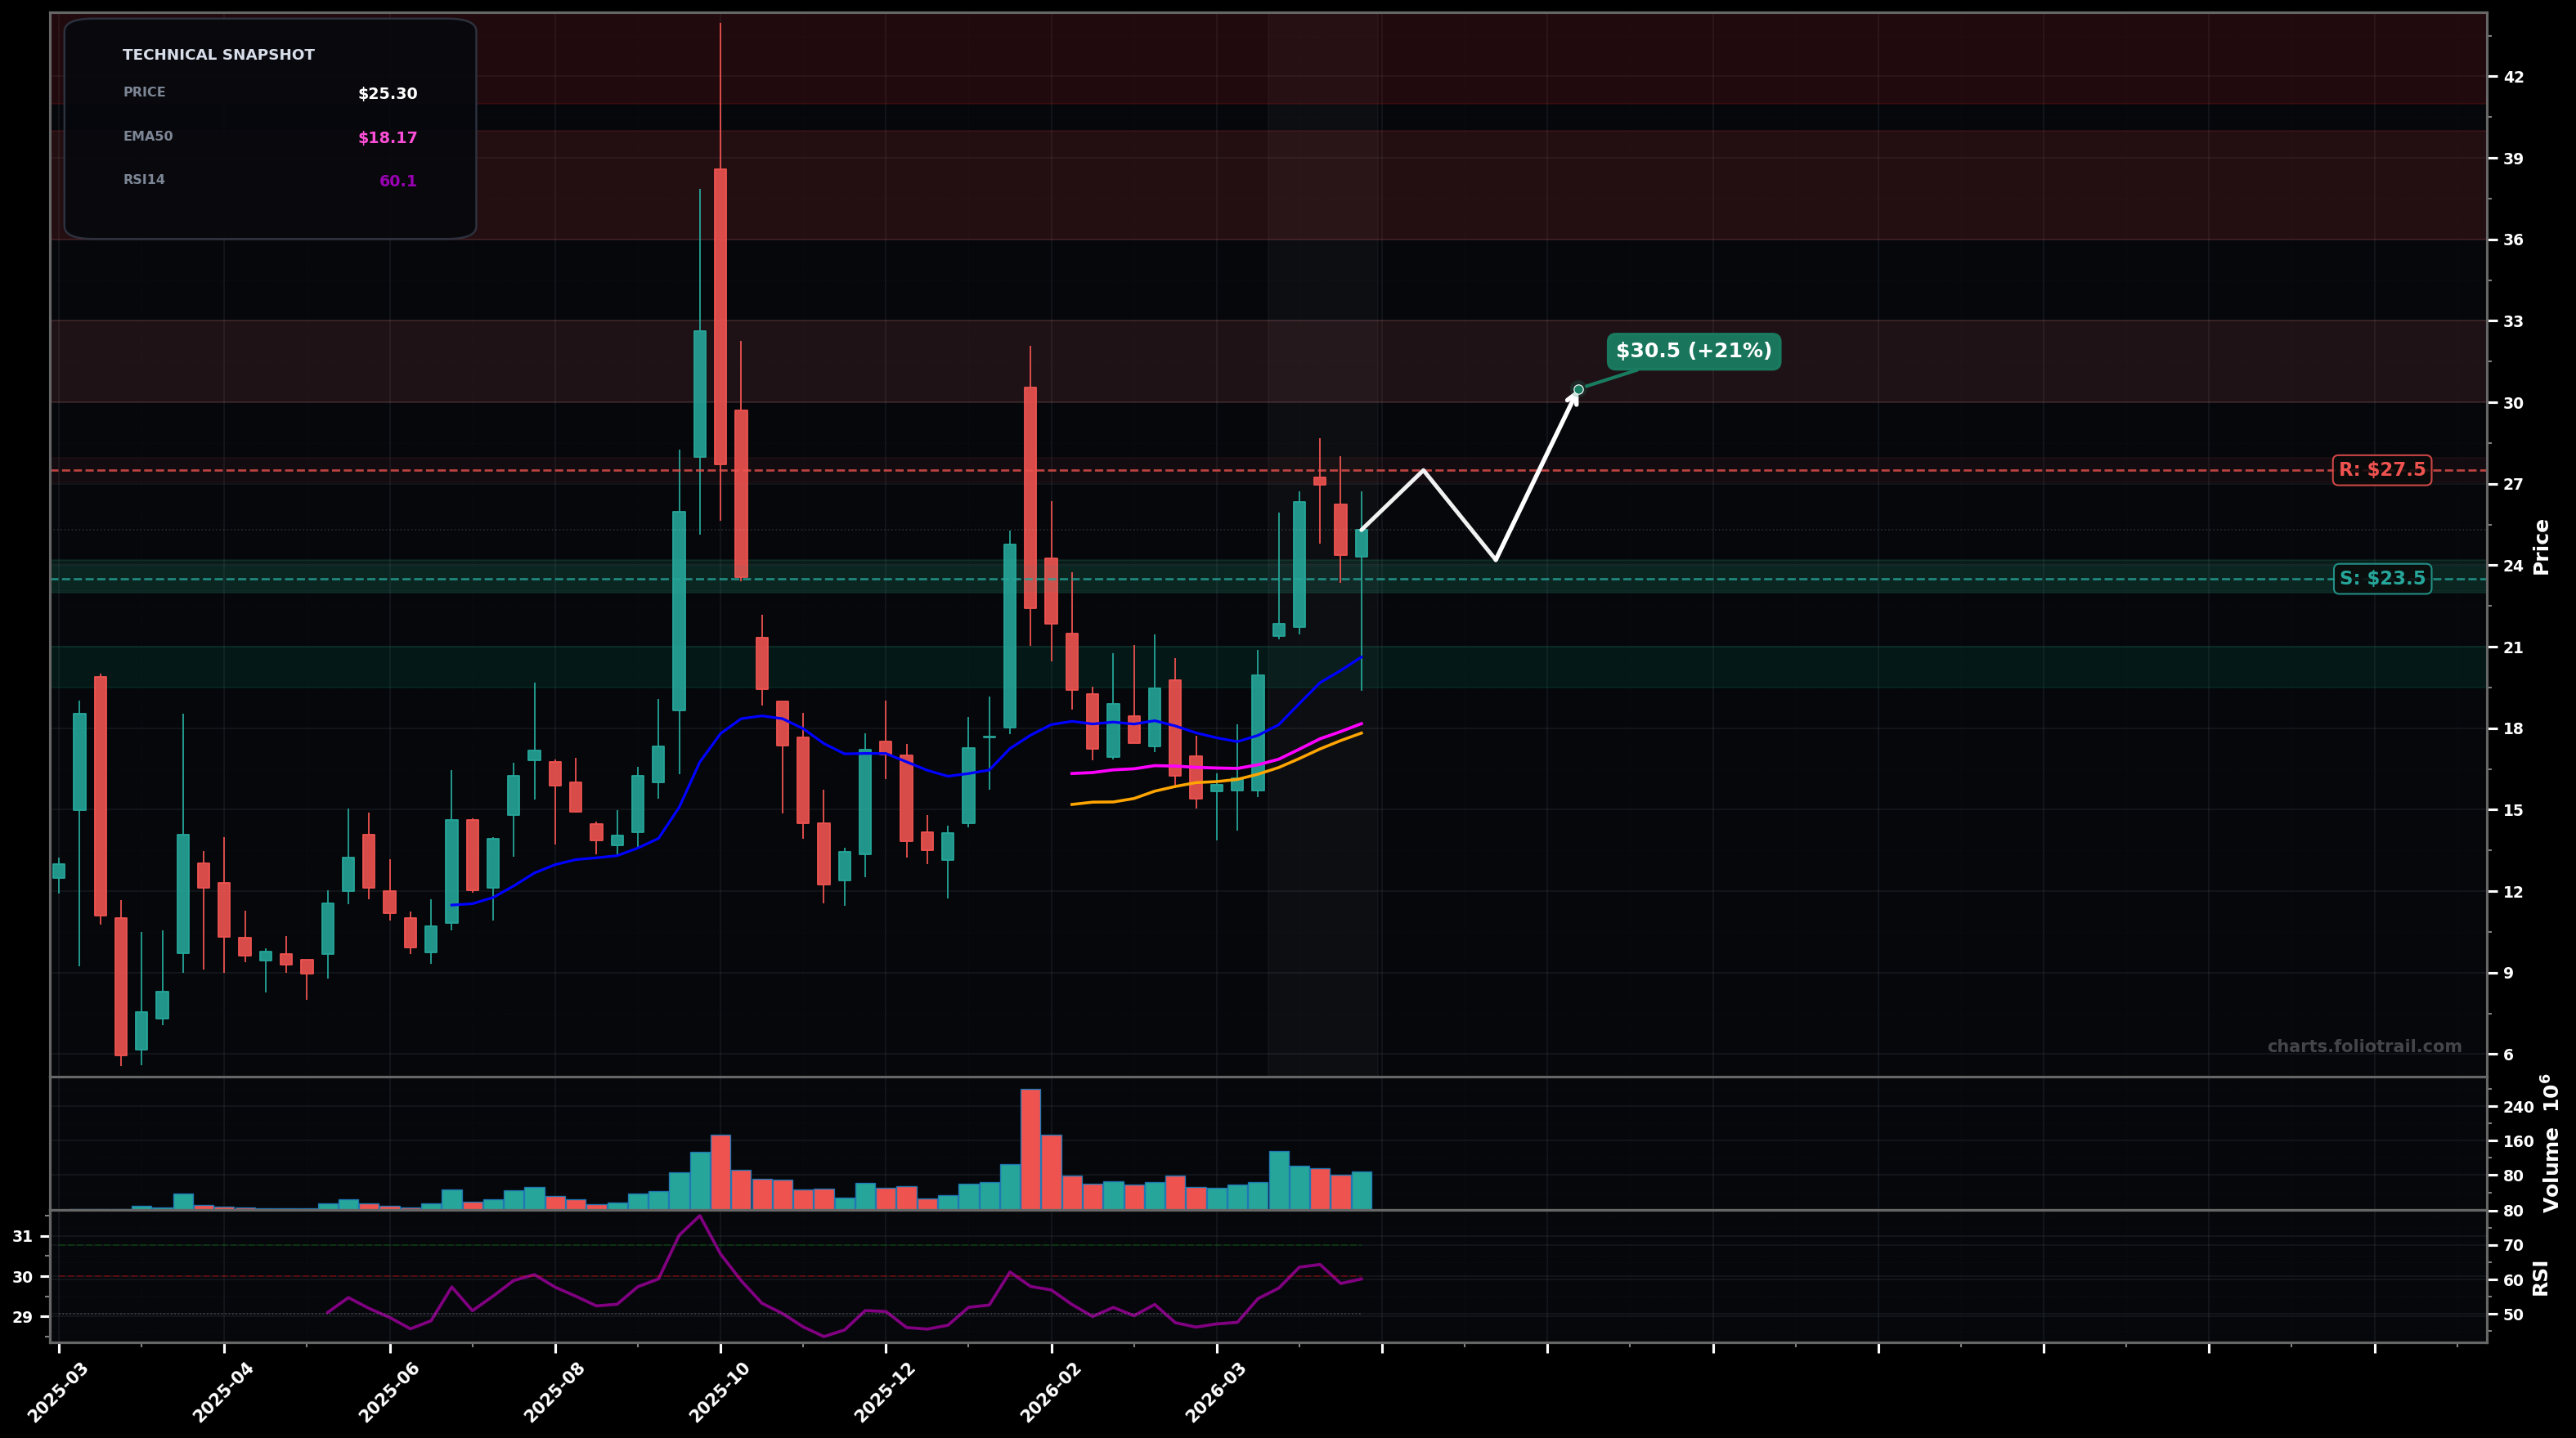
As of May 22, 2026, USAR (USA Rare Earth, Inc.) is in a choppy range state on the weekly chart, with a confidence level of 62%. Key support is at $23.5 and key resistance at $27.5. Weekly price at ~$25.30 pulled back from a recent push toward ~$27-$28; still holding above rising EMA20/EMA50 and above SMA50, with RSI ~60 (bullish momentum but not overbought).
Range continuation with a bullish bias: dip holds above the $23.50-$22.50 demand zone, then price retests $27.50 and attempts a breakout toward the prior supply at ~$30-$31.
Failed retest / distribution: rejection near $27.50-$28.50 rolls over and breaks $23.50 support, leading to a move back toward the MA cluster and prior pivot demand near ~$21-$20.
2+ weekly closes holding above $27.50 (then $30.00) would shift to BREAKOUT_REVERSAL/uptrend behavior
A weekly close below $21.00 would negate the current range-bull bias and favor a deeper breakdown
Start near range support; add on deeper pullback into MA/structure demand; heavy add only if a capitulation-style flush tags prior pivot demand while trend structure still repairable.
Trim into major overhead supply from prior spike highs (Fibonacci/structure resistance zones); progressively de-risk as price approaches the extreme upper tail region where mean-reversion risk rises.
As of May 22, 2026, USAR (USA Rare Earth, Inc.) is in a choppy range state on the weekly chart with 62% confidence. Weekly price at ~$25.30 pulled back from a recent push toward ~$27-$28; still holding above rising EMA20/EMA50 and above SMA50, with RSI ~60 (bullish momentum but not overbought).
On the weekly timeframe, USAR has key support at $23.5 and key resistance at $27.5. The most likely scenario (bullish) targets $27.5 and $30.5, with a revert level at $24.2.
USAR (USA Rare Earth, Inc.) is currently classified as choppy range on the weekly chart, with 62% confidence. Confirmation requires: 2+ weekly closes holding above $27.50 (then $30.00) would shift to BREAKOUT_REVERSAL/uptrend behavior This would be invalidated by: A weekly close below $21.00 would negate the current range-bull bias and favor a deeper breakdown
The most likely scenario (bullish) targets $27.5 and $30.5, with a revert level at $24.2. The alternative scenario (bearish) targets $22.0 and $20.0.
Multi-layer AI agents analyse 200+ stocks across daily, weekly, and monthly timeframes — producing market state classifications, price scenarios with targets, and position entry/exit levels. Daily charts updated every trading day at 6 PM ET. Weekly charts refresh Fridays. Monthly charts refresh on the last trading day of each month. No paywall. No sign-up required.
Built by Foliotrail.
All content on this website — including charts, analysis, price targets, support/resistance levels, and position zones — is generated entirely by AI and provided for educational and informational purposes only.
This is not financial advice. NEXUSNOIR VENTURES SL (the operator of this website) is not a registered investment adviser or broker-dealer. You should not make investment decisions based solely on this information. Always do your own research and consult a qualified financial advisor.
By continuing, you acknowledge that you have read and agree to our full disclaimer & terms of use and privacy policy.