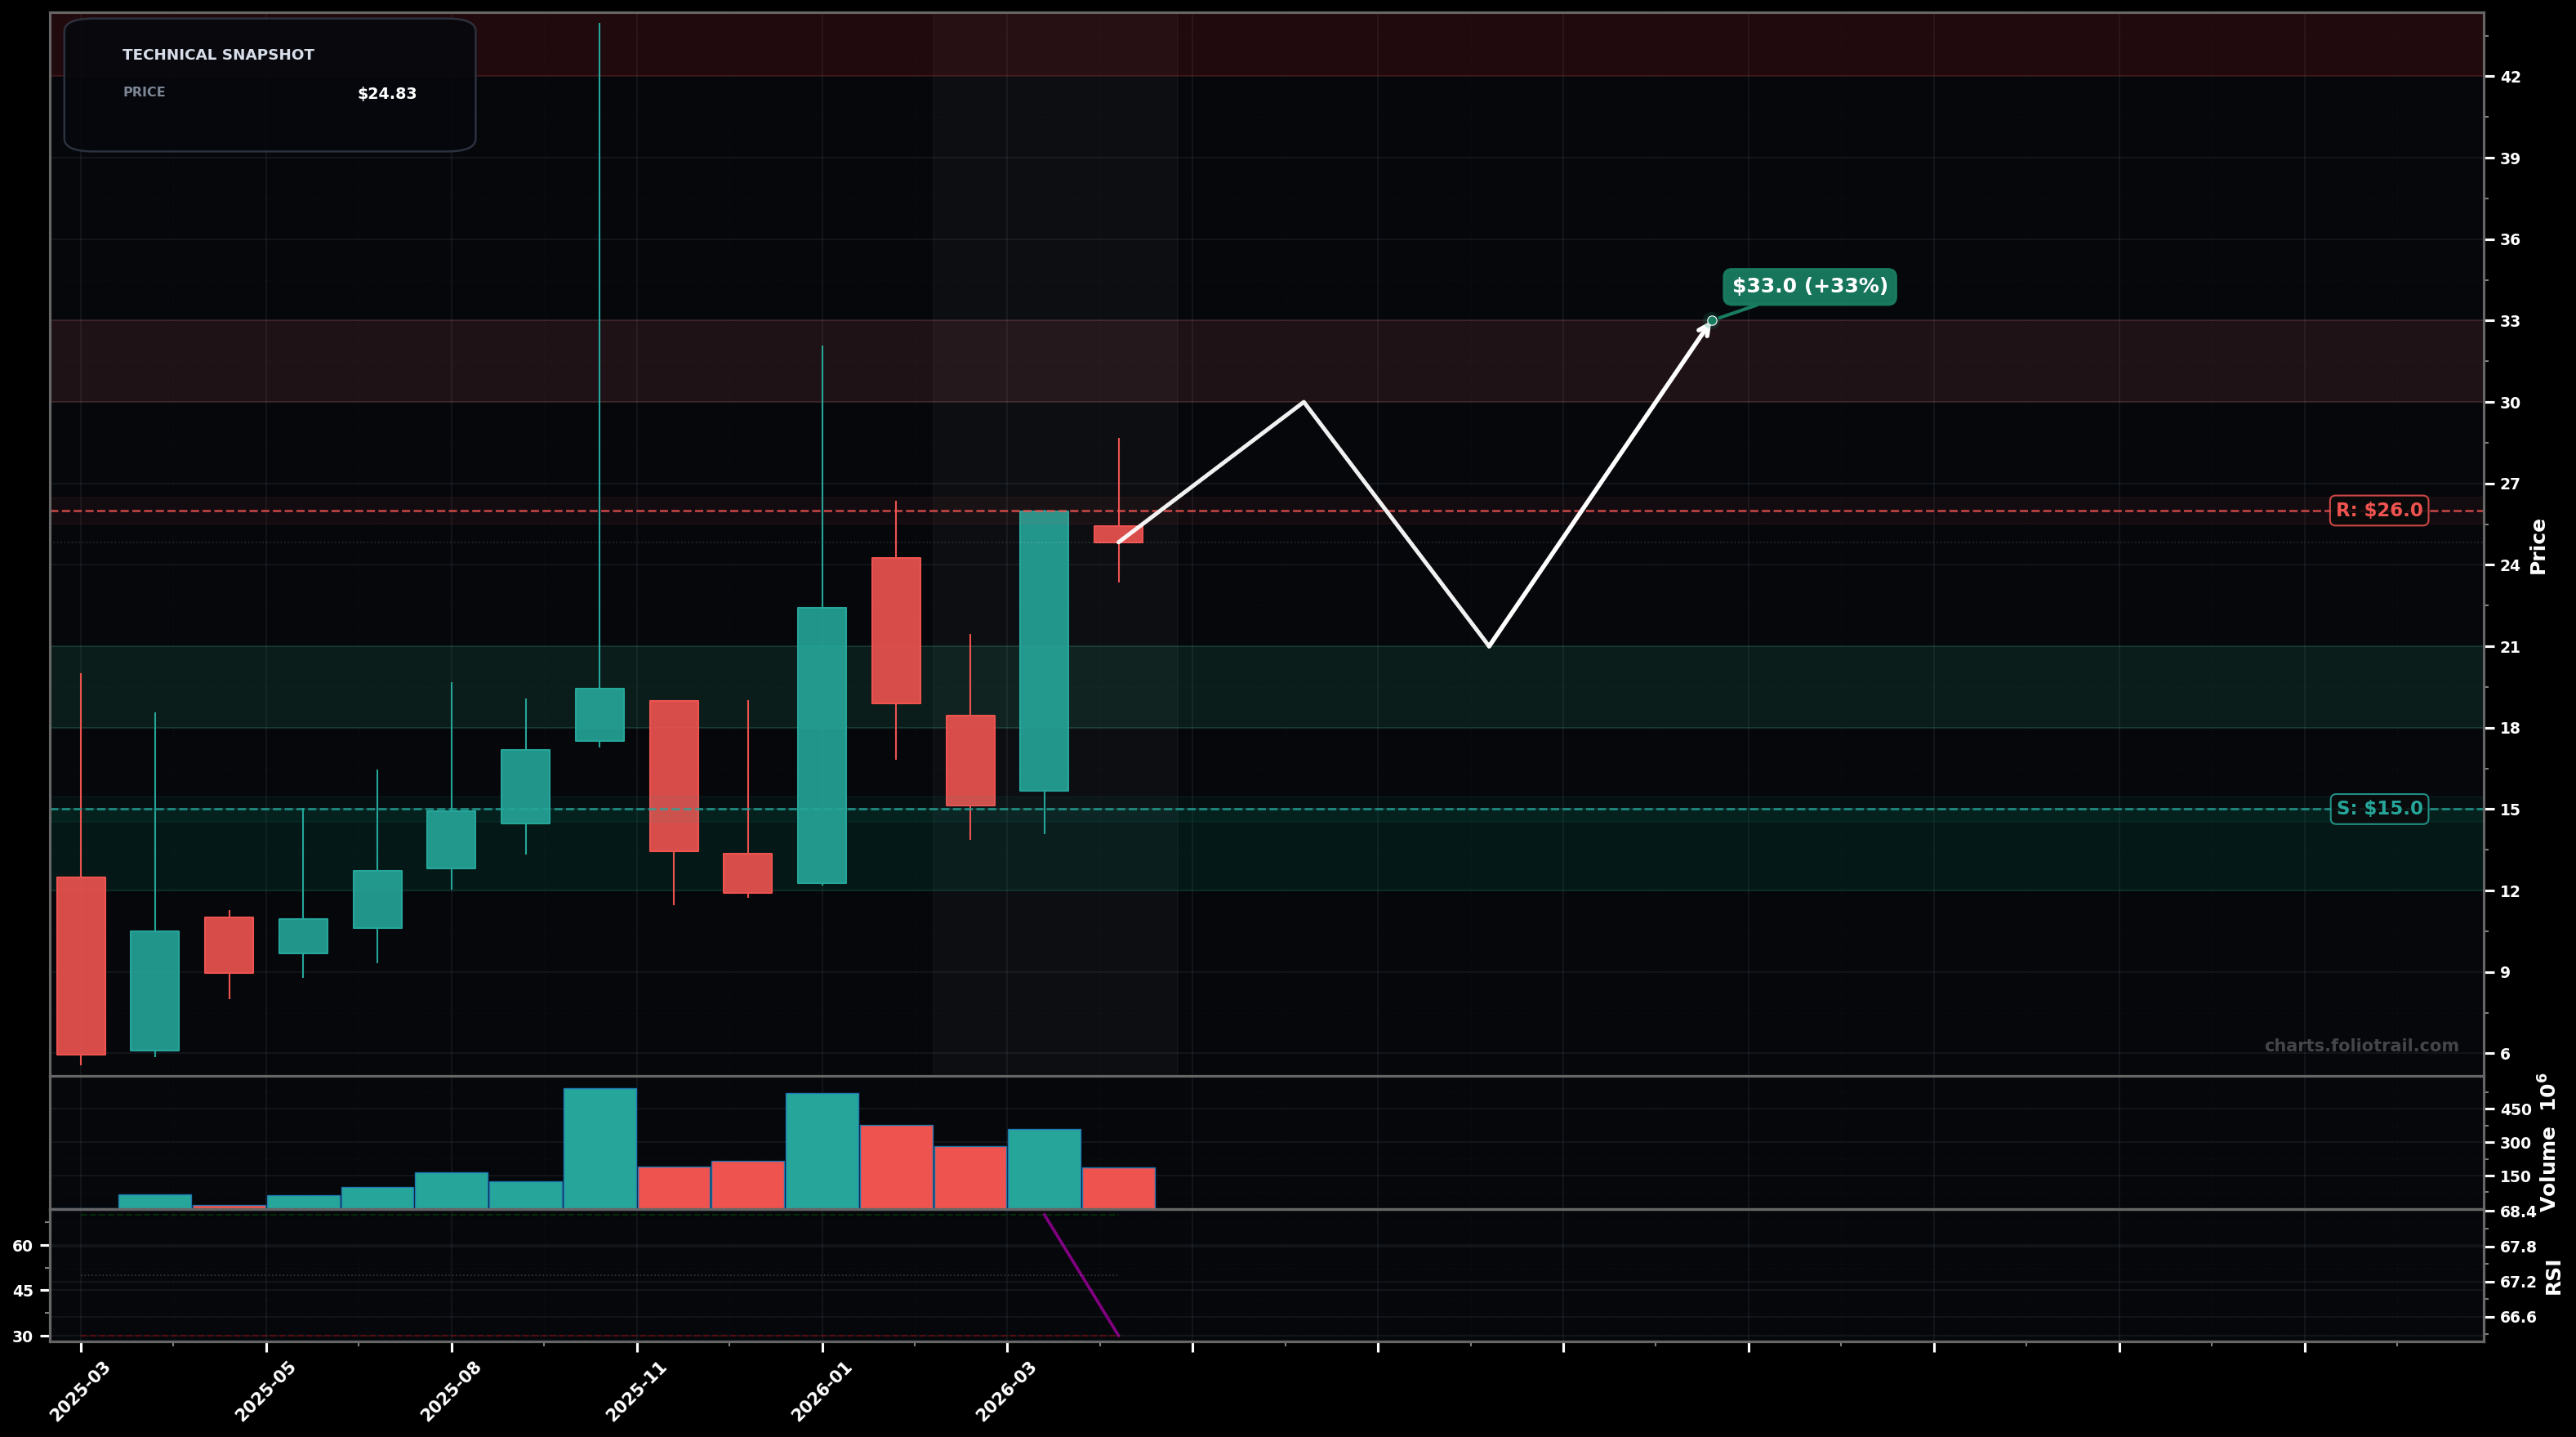
As of May 15, 2026, USAR (USA Rare Earth, Inc.) is in a volatility expansion state on the monthly chart, with a confidence level of 58%. Key support is at $15.0 and key resistance at $26.0. Monthly price around $24.83 after a strong rally attempt, stalling just below recent swing high zone; RSI(14) ~66 suggests momentum but not extreme.
Bullish continuation: price holds above the $18-$15 demand zone (prior swing-low area) and breaks/holds above the $26 overhead supply, implying the next impulse leg higher (Elliott: likely wave (3) extension or wave 5 push if the prior spike was wave (3)).
Bearish pullback/failed breakout: rejection from $26 leads to a deeper ABC-style retrace toward the prior base; volatility remains elevated and a retest of the breakout origin becomes likely (Fib-style mean reversion toward the 50%-61.8% zone of the last major upswing).
2 monthly closes above $26.00
Monthly close below $15.00
Scale-in around prior swing structure: $18-$21 = pullback support, $15-$18 = key pivot demand, $12-$15 = deeper retrace/undercut zone if volatility flushes.
Trim into overhead supply/extension: $30-$33 is first measured-move/round-number resistance, $36-$39 is prior wick/extension risk, $42-$45 is extreme extension vs recent range where mean-reversion risk is highest.
As of May 15, 2026, USAR (USA Rare Earth, Inc.) is in a volatility expansion state on the monthly chart with 58% confidence. Monthly price around $24.83 after a strong rally attempt, stalling just below recent swing high zone; RSI(14) ~66 suggests momentum but not extreme.
On the monthly timeframe, USAR has key support at $15.0 and key resistance at $26.0. The most likely scenario (bullish) targets $30.0 and $33.0, with a revert level at $21.0.
USAR (USA Rare Earth, Inc.) is currently classified as volatility expansion on the monthly chart, with 58% confidence. Confirmation requires: 2 monthly closes above $26.00 This would be invalidated by: Monthly close below $15.00
The most likely scenario (bullish) targets $30.0 and $33.0, with a revert level at $21.0. The alternative scenario (bearish) targets $18.0 and $15.0.
Multi-layer AI agents analyse 200+ stocks across daily, weekly, and monthly timeframes — producing market state classifications, price scenarios with targets, and position entry/exit levels. Daily charts updated every trading day at 6 PM ET. Weekly charts refresh Fridays. Monthly charts refresh on the last trading day of each month. No paywall. No sign-up required.
Built by Foliotrail.
All content on this website — including charts, analysis, price targets, support/resistance levels, and position zones — is generated entirely by AI and provided for educational and informational purposes only.
This is not financial advice. NEXUSNOIR VENTURES SL (the operator of this website) is not a registered investment adviser or broker-dealer. You should not make investment decisions based solely on this information. Always do your own research and consult a qualified financial advisor.
By continuing, you acknowledge that you have read and agree to our full disclaimer & terms of use and privacy policy.