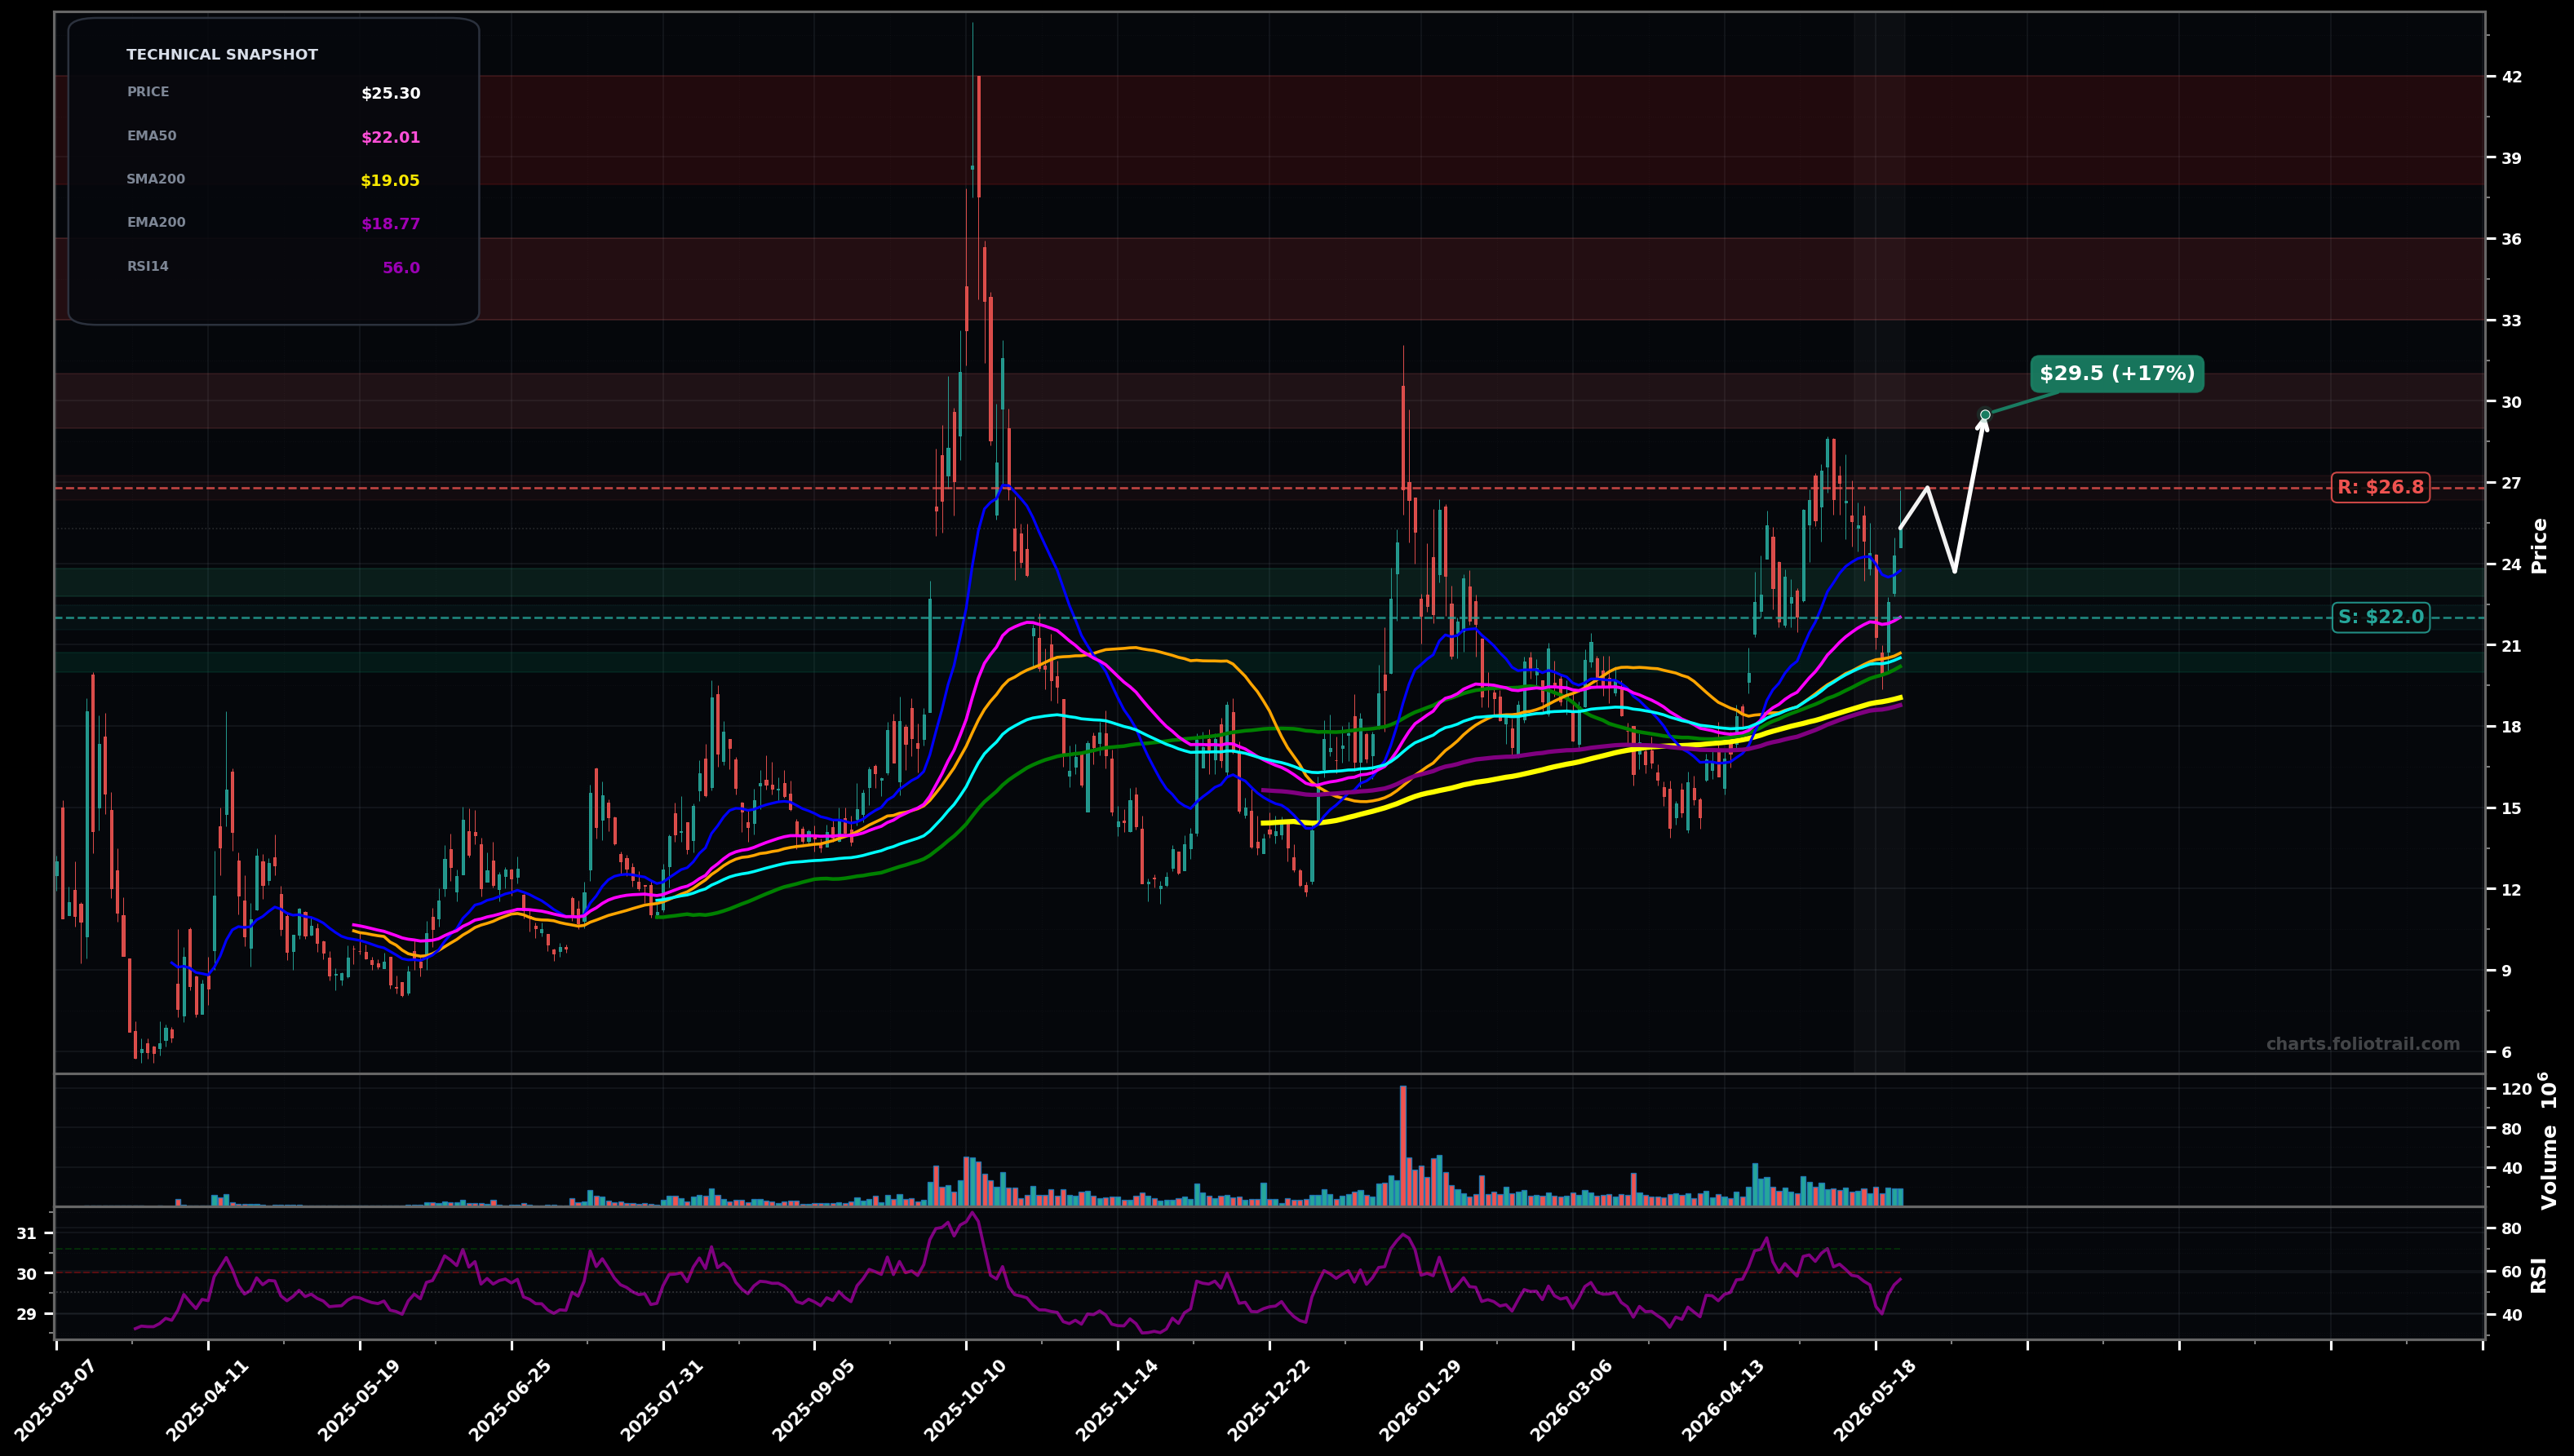
As of May 22, 2026, USAR (USA Rare Earth, Inc.) is in a uptrend state on the daily chart, with a confidence level of 67%. Key support is at $22.0 and key resistance at $26.8. Price at ~$25.30 is holding above the rising EMA50 (~$22.01) and above EMA100 (~$20.52), after a sharp April run-up and a mild pullback/consolidation; RSI14 ~56 (not overbought).
Bullish continuation: pullback holds $22.0–$23.2 (EMA50/20 zone) then breakout over $26.8, aiming for a measured move toward prior supply near the high-$20s.
Bearish/range breakdown: rejection under $26.8 followed by a loss of EMA50 leads to a deeper mean-reversion toward the $20–$21 MA cluster (EMA100/SMA100/SMA50 zone).
2+ daily closes above $26.80 (range top/near recent pivot) would confirm continuation
Daily close below $22.00 (EMA50 area) would invalidate the clean uptrend/force range-bear case
Scale at EMA20/50 support first, add on EMA50 reclaim/hold, heavy add at EMA100/SMA100 confluence where prior breakout base likely sits.
Trim into likely fib/overhead-supply zones from the prior spike structure; higher zones align with historical blow-off area where volatility/reversal risk rises.
As of May 22, 2026, USAR (USA Rare Earth, Inc.) is in a uptrend state on the daily chart with 67% confidence. Price at ~$25.30 is holding above the rising EMA50 (~$22.01) and above EMA100 (~$20.52), after a sharp April run-up and a mild pullback/consolidation; RSI14 ~56 (not overbought).
On the daily timeframe, USAR has key support at $22.0 and key resistance at $26.8. The most likely scenario (bullish) targets $26.8 and $29.5, with a revert level at $23.7.
USAR (USA Rare Earth, Inc.) is currently classified as uptrend on the daily chart, with 67% confidence. Confirmation requires: 2+ daily closes above $26.80 (range top/near recent pivot) would confirm continuation This would be invalidated by: Daily close below $22.00 (EMA50 area) would invalidate the clean uptrend/force range-bear case
The most likely scenario (bullish) targets $26.8 and $29.5, with a revert level at $23.7. The alternative scenario (bearish) targets $22.0 and $20.5.
Multi-layer AI agents analyse 200+ stocks across daily, weekly, and monthly timeframes — producing market state classifications, price scenarios with targets, and position entry/exit levels. Daily charts updated every trading day at 6 PM ET. Weekly charts refresh Fridays. Monthly charts refresh on the last trading day of each month. No paywall. No sign-up required.
Built by Foliotrail.
All content on this website — including charts, analysis, price targets, support/resistance levels, and position zones — is generated entirely by AI and provided for educational and informational purposes only.
This is not financial advice. NEXUSNOIR VENTURES SL (the operator of this website) is not a registered investment adviser or broker-dealer. You should not make investment decisions based solely on this information. Always do your own research and consult a qualified financial advisor.
By continuing, you acknowledge that you have read and agree to our full disclaimer & terms of use and privacy policy.