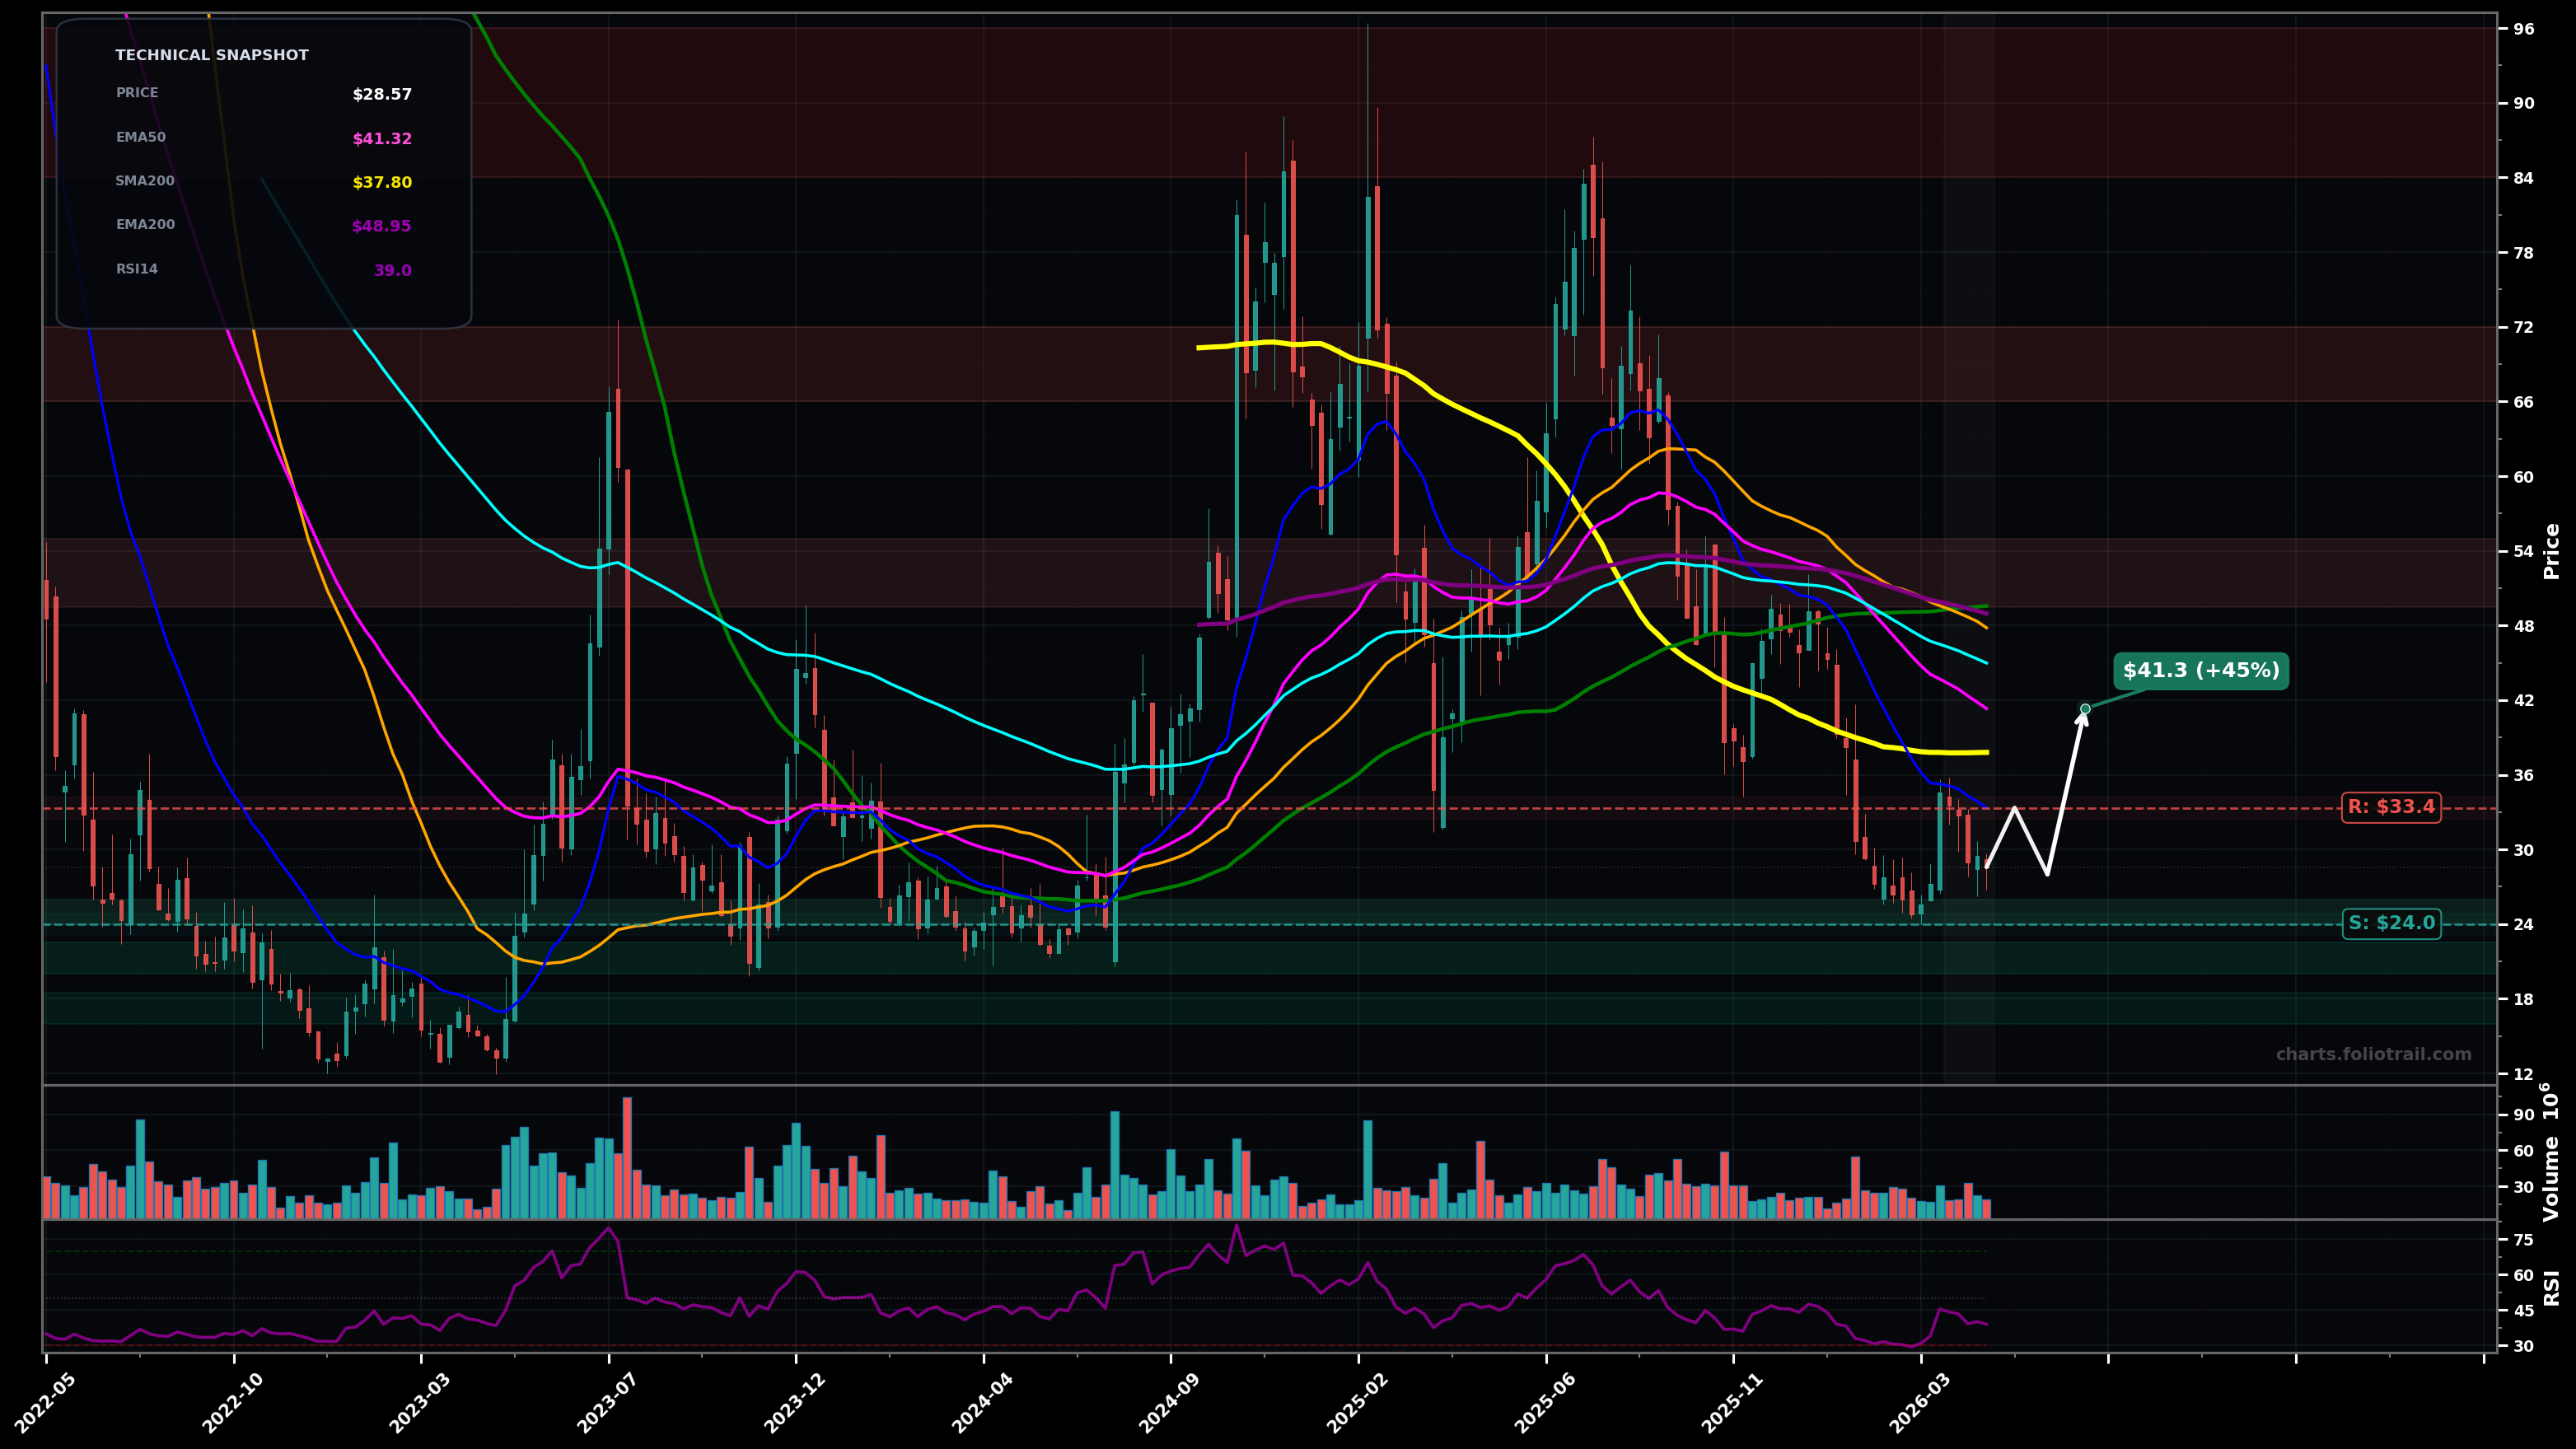
As of May 22, 2026, UPST (Upstart Holdings, Inc.) is in a downtrend state on the weekly chart, with a confidence level of 78%. Key support is at $24.0 and key resistance at $33.4. Weekly price at $28.57 is below all key MAs (EMA50/100/200 and SMA50/100/200) after a sharp leg down; recent bounce failed to reclaim broken support and momentum (RSI~39) remains weak.
Base-building / weak bounce: price holds $24-$25 (recent swing-low zone) and grinds up into $33-$36 where sellers likely reappear; if it can accept above that, next mean-reversion magnet is the $41 area (EMA50). (~60%)
Trend continuation: a breakdown under $24 triggers another LL, likely accelerating toward the next demand pocket around low-$20s/high-teens (prior base/extension zone), before any larger rebound attempt. (~40%)
Weekly close back above $33.35 (EMA20) followed by a second close holding above $33.35.
Weekly close above $41.32 (EMA50) would invalidate the current downtrend bias.
Scale-in only at/under the $24 swing-low support, then add on a washout toward prior demand ($20s/teens) while price remains below EMA50/EMA100 overhead supply.
Trim into major overhead MA clusters/prior distribution zones ($50s then $70s), and consider full exit into a retest of the prior peak/liquidity area ($80s-$90s).
As of May 22, 2026, UPST (Upstart Holdings, Inc.) is in a downtrend state on the weekly chart with 78% confidence. Weekly price at $28.57 is below all key MAs (EMA50/100/200 and SMA50/100/200) after a sharp leg down; recent bounce failed to reclaim broken support and momentum (RSI~39) remains weak.
On the weekly timeframe, UPST has key support at $24.0 and key resistance at $33.4. The most likely scenario (bullish) targets $33.4 and $41.3, with a revert level at $28.0.
UPST (Upstart Holdings, Inc.) is currently classified as downtrend on the weekly chart, with 78% confidence. Confirmation requires: Weekly close back above $33.35 (EMA20) followed by a second close holding above $33.35. This would be invalidated by: Weekly close above $41.32 (EMA50) would invalidate the current downtrend bias.
The most likely scenario (bullish) targets $33.4 and $41.3, with a revert level at $28.0. The alternative scenario (bearish) targets $20.0 and $16.0.
Multi-layer AI agents analyse 200+ stocks across daily, weekly, and monthly timeframes — producing market state classifications, price scenarios with targets, and position entry/exit levels. Daily charts updated every trading day at 6 PM ET. Weekly charts refresh Fridays. Monthly charts refresh on the last trading day of each month. No paywall. No sign-up required.
Built by Foliotrail.
All content on this website — including charts, analysis, price targets, support/resistance levels, and position zones — is generated entirely by AI and provided for educational and informational purposes only.
This is not financial advice. NEXUSNOIR VENTURES SL (the operator of this website) is not a registered investment adviser or broker-dealer. You should not make investment decisions based solely on this information. Always do your own research and consult a qualified financial advisor.
By continuing, you acknowledge that you have read and agree to our full disclaimer & terms of use and privacy policy.