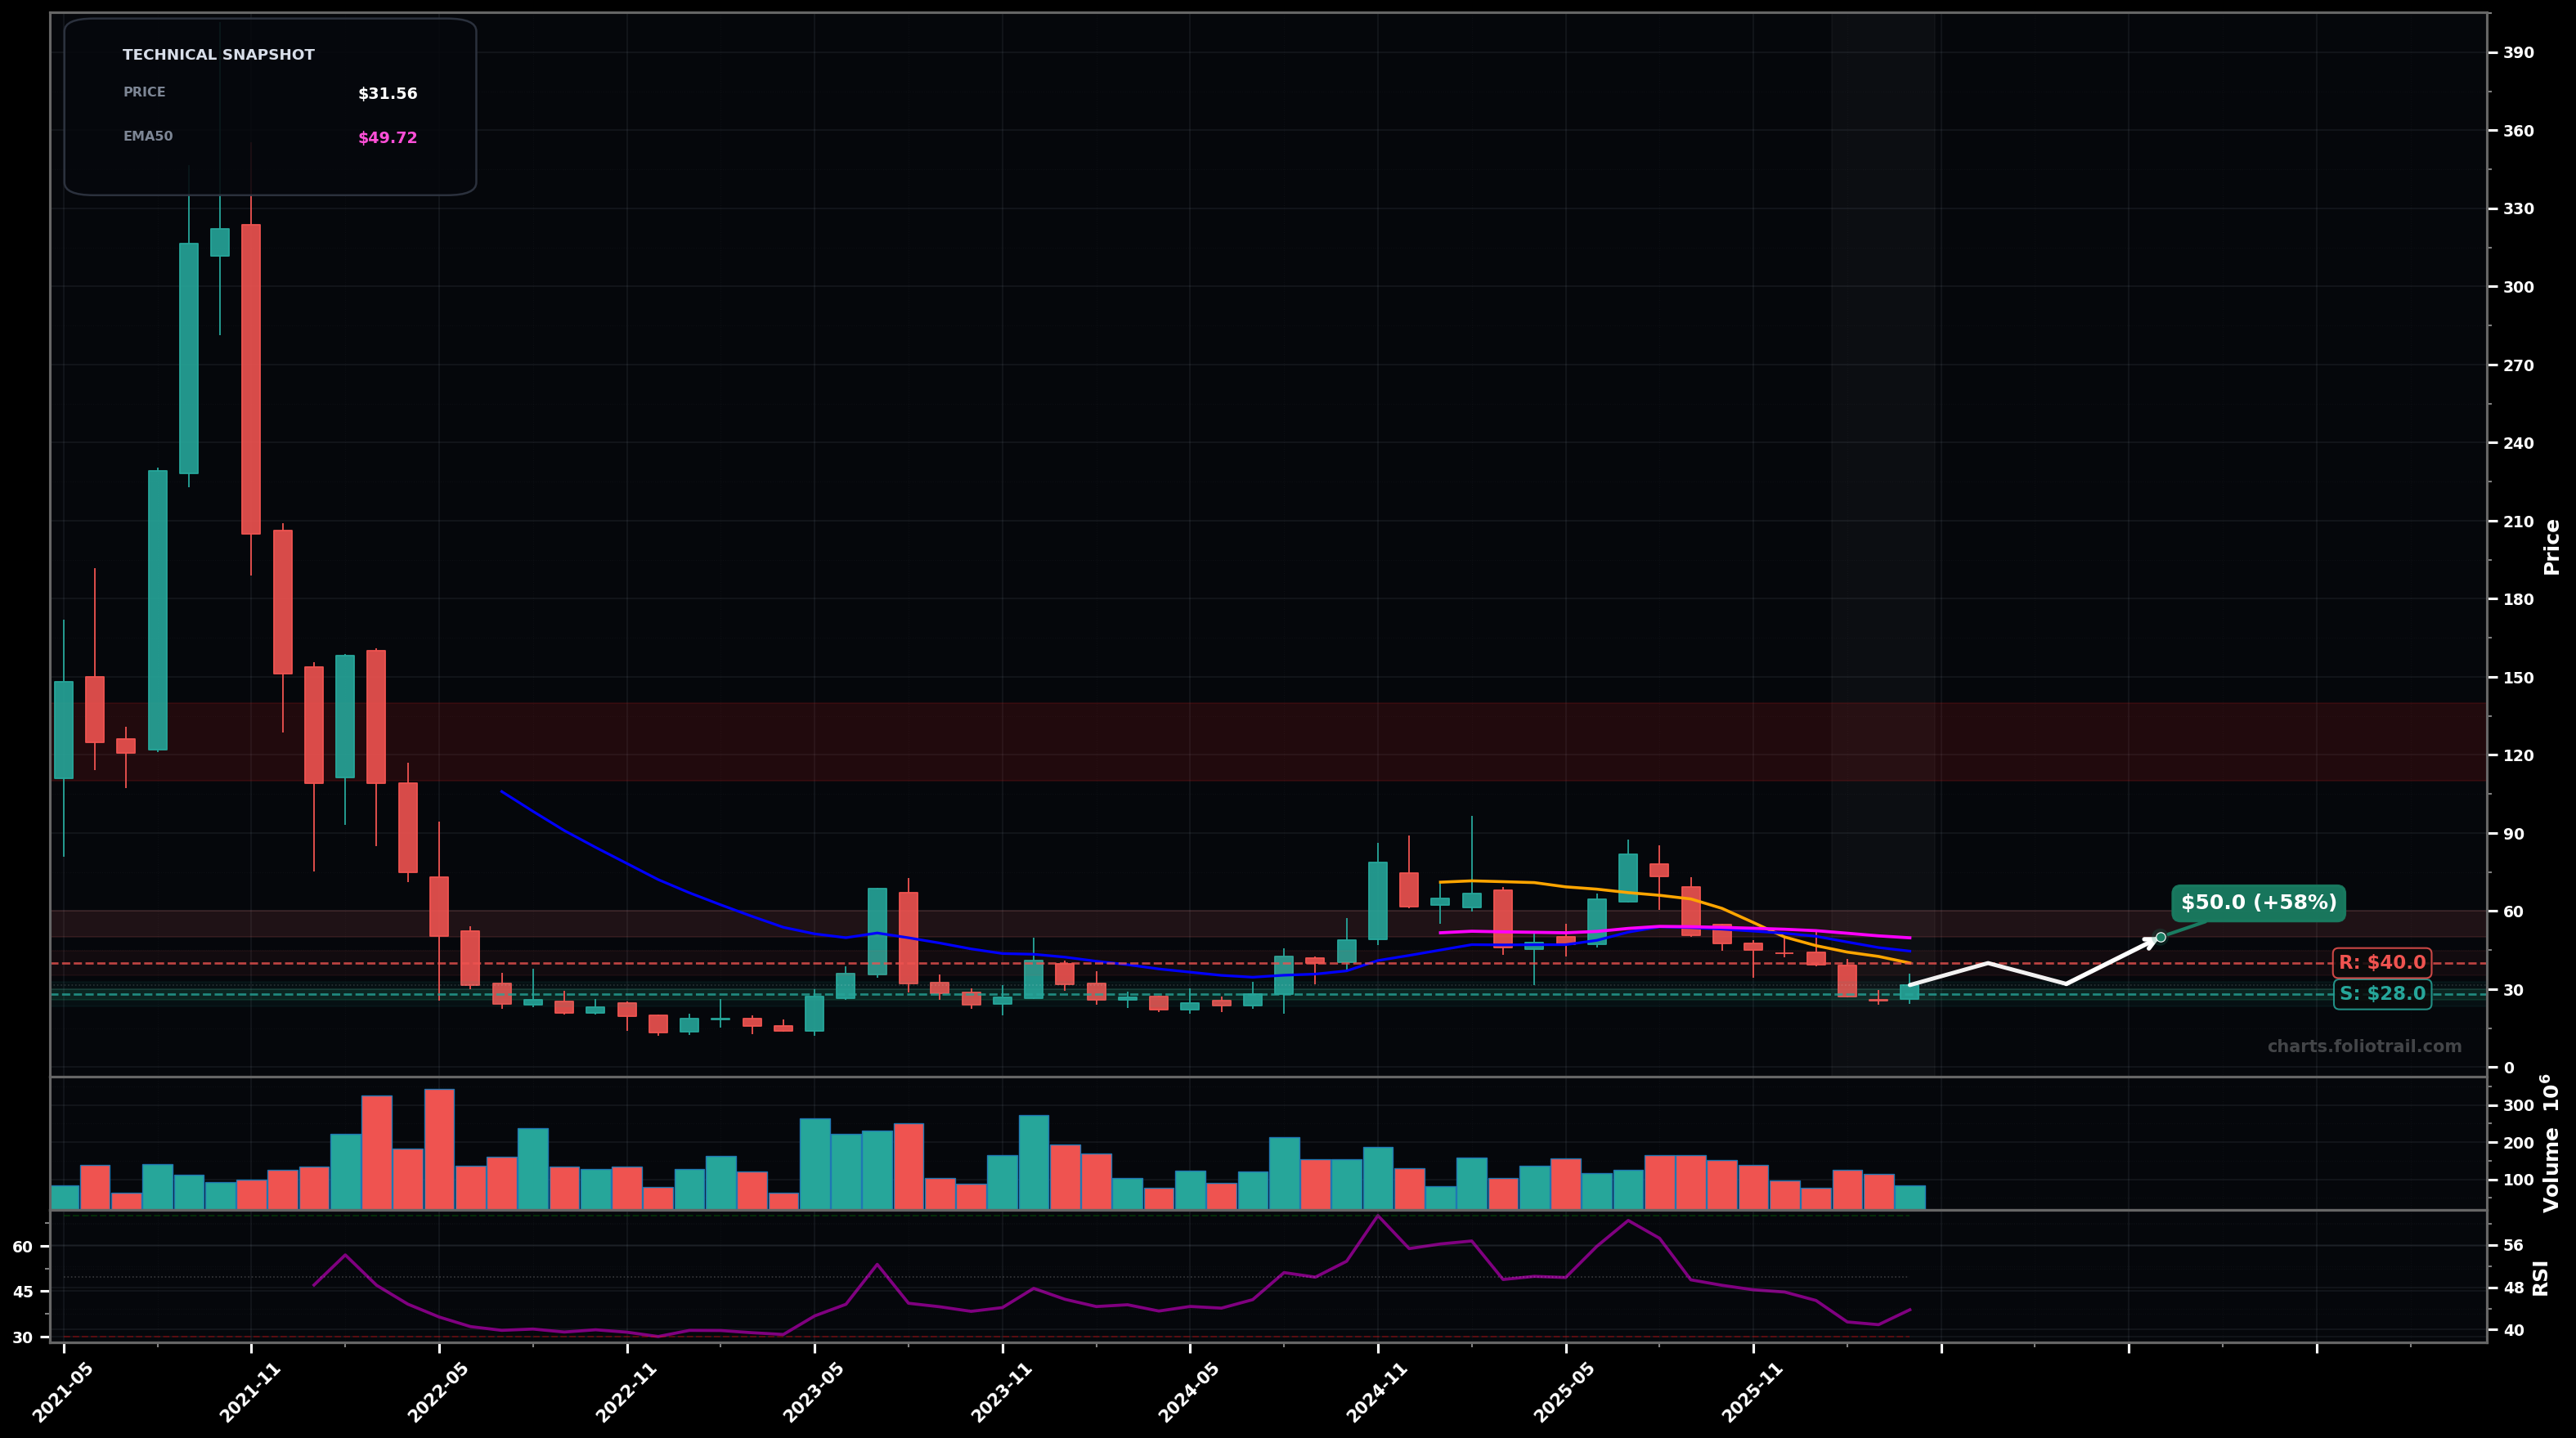
As of April 30, 2026, UPST (Upstart Holdings, Inc.) is in a downtrend state on the monthly chart, with a confidence level of 72%. Key support is at $28.0 and key resistance at $40.0. Monthly down-swing continues; price ~$31.56 is below EMA50 (~$49.72), EMA200 (~$44.59) and SMA50 (~$40.03) with RSI ~43.8 trying to curl up from weak momentum.
Base-building attempt: hold the $28–$30 swing-low area, then mean-revert toward the MA cluster; likely a corrective bounce (Elliott: wave B/2) before a tougher decision at ~$40–$50.
Trend continuation: lose $28–$30 support and flush into the low-$20s (Elliott: wave C/3 continuation); any bounce gets sold back below ~$40.
DOWNTREND confirmed on a monthly close below $30.00
Invalidated on 2 consecutive monthly closes above $50.00 (reclaim EMA50 zone)
Stagger entries around the swing-low shelf (~$28–$30) and prior demand pockets (low-$20s) while price is below the falling EMA50; size up only if capitulation-style discounts print.
Trim into Fibonacci/structure supply and MA reclaims: ~$50–$60 (first major MA/structure), heavier into ~$70–$90 (prior swing supply), and fully exit into $110+ if price becomes stretched relative to long-term mean.
As of April 30, 2026, UPST (Upstart Holdings, Inc.) is in a downtrend state on the monthly chart with 72% confidence. Monthly down-swing continues; price ~$31.56 is below EMA50 (~$49.72), EMA200 (~$44.59) and SMA50 (~$40.03) with RSI ~43.8 trying to curl up from weak momentum.
On the monthly timeframe, UPST has key support at $28.0 and key resistance at $40.0. The most likely scenario (bullish) targets $40.0 and $50.0, with a revert level at $32.0.
UPST (Upstart Holdings, Inc.) is currently classified as downtrend on the monthly chart, with 72% confidence. Confirmation requires: DOWNTREND confirmed on a monthly close below $30.00 This would be invalidated by: Invalidated on 2 consecutive monthly closes above $50.00 (reclaim EMA50 zone)
The most likely scenario (bullish) targets $40.0 and $50.0, with a revert level at $32.0. The alternative scenario (bearish) targets $24.0 and $18.0.
Multi-layer AI agents analyse 200+ stocks across daily, weekly, and monthly timeframes — producing market state classifications, price scenarios with targets, and position entry/exit levels. Daily charts updated every trading day at 6 PM ET. Weekly charts refresh Fridays. Monthly charts refresh on the last trading day of each month. No paywall. No sign-up required.
Built by Foliotrail.
All content on this website — including charts, analysis, price targets, support/resistance levels, and position zones — is generated entirely by AI and provided for educational and informational purposes only.
This is not financial advice. NEXUSNOIR VENTURES SL (the operator of this website) is not a registered investment adviser or broker-dealer. You should not make investment decisions based solely on this information. Always do your own research and consult a qualified financial advisor.
By continuing, you acknowledge that you have read and agree to our full disclaimer & terms of use and privacy policy.