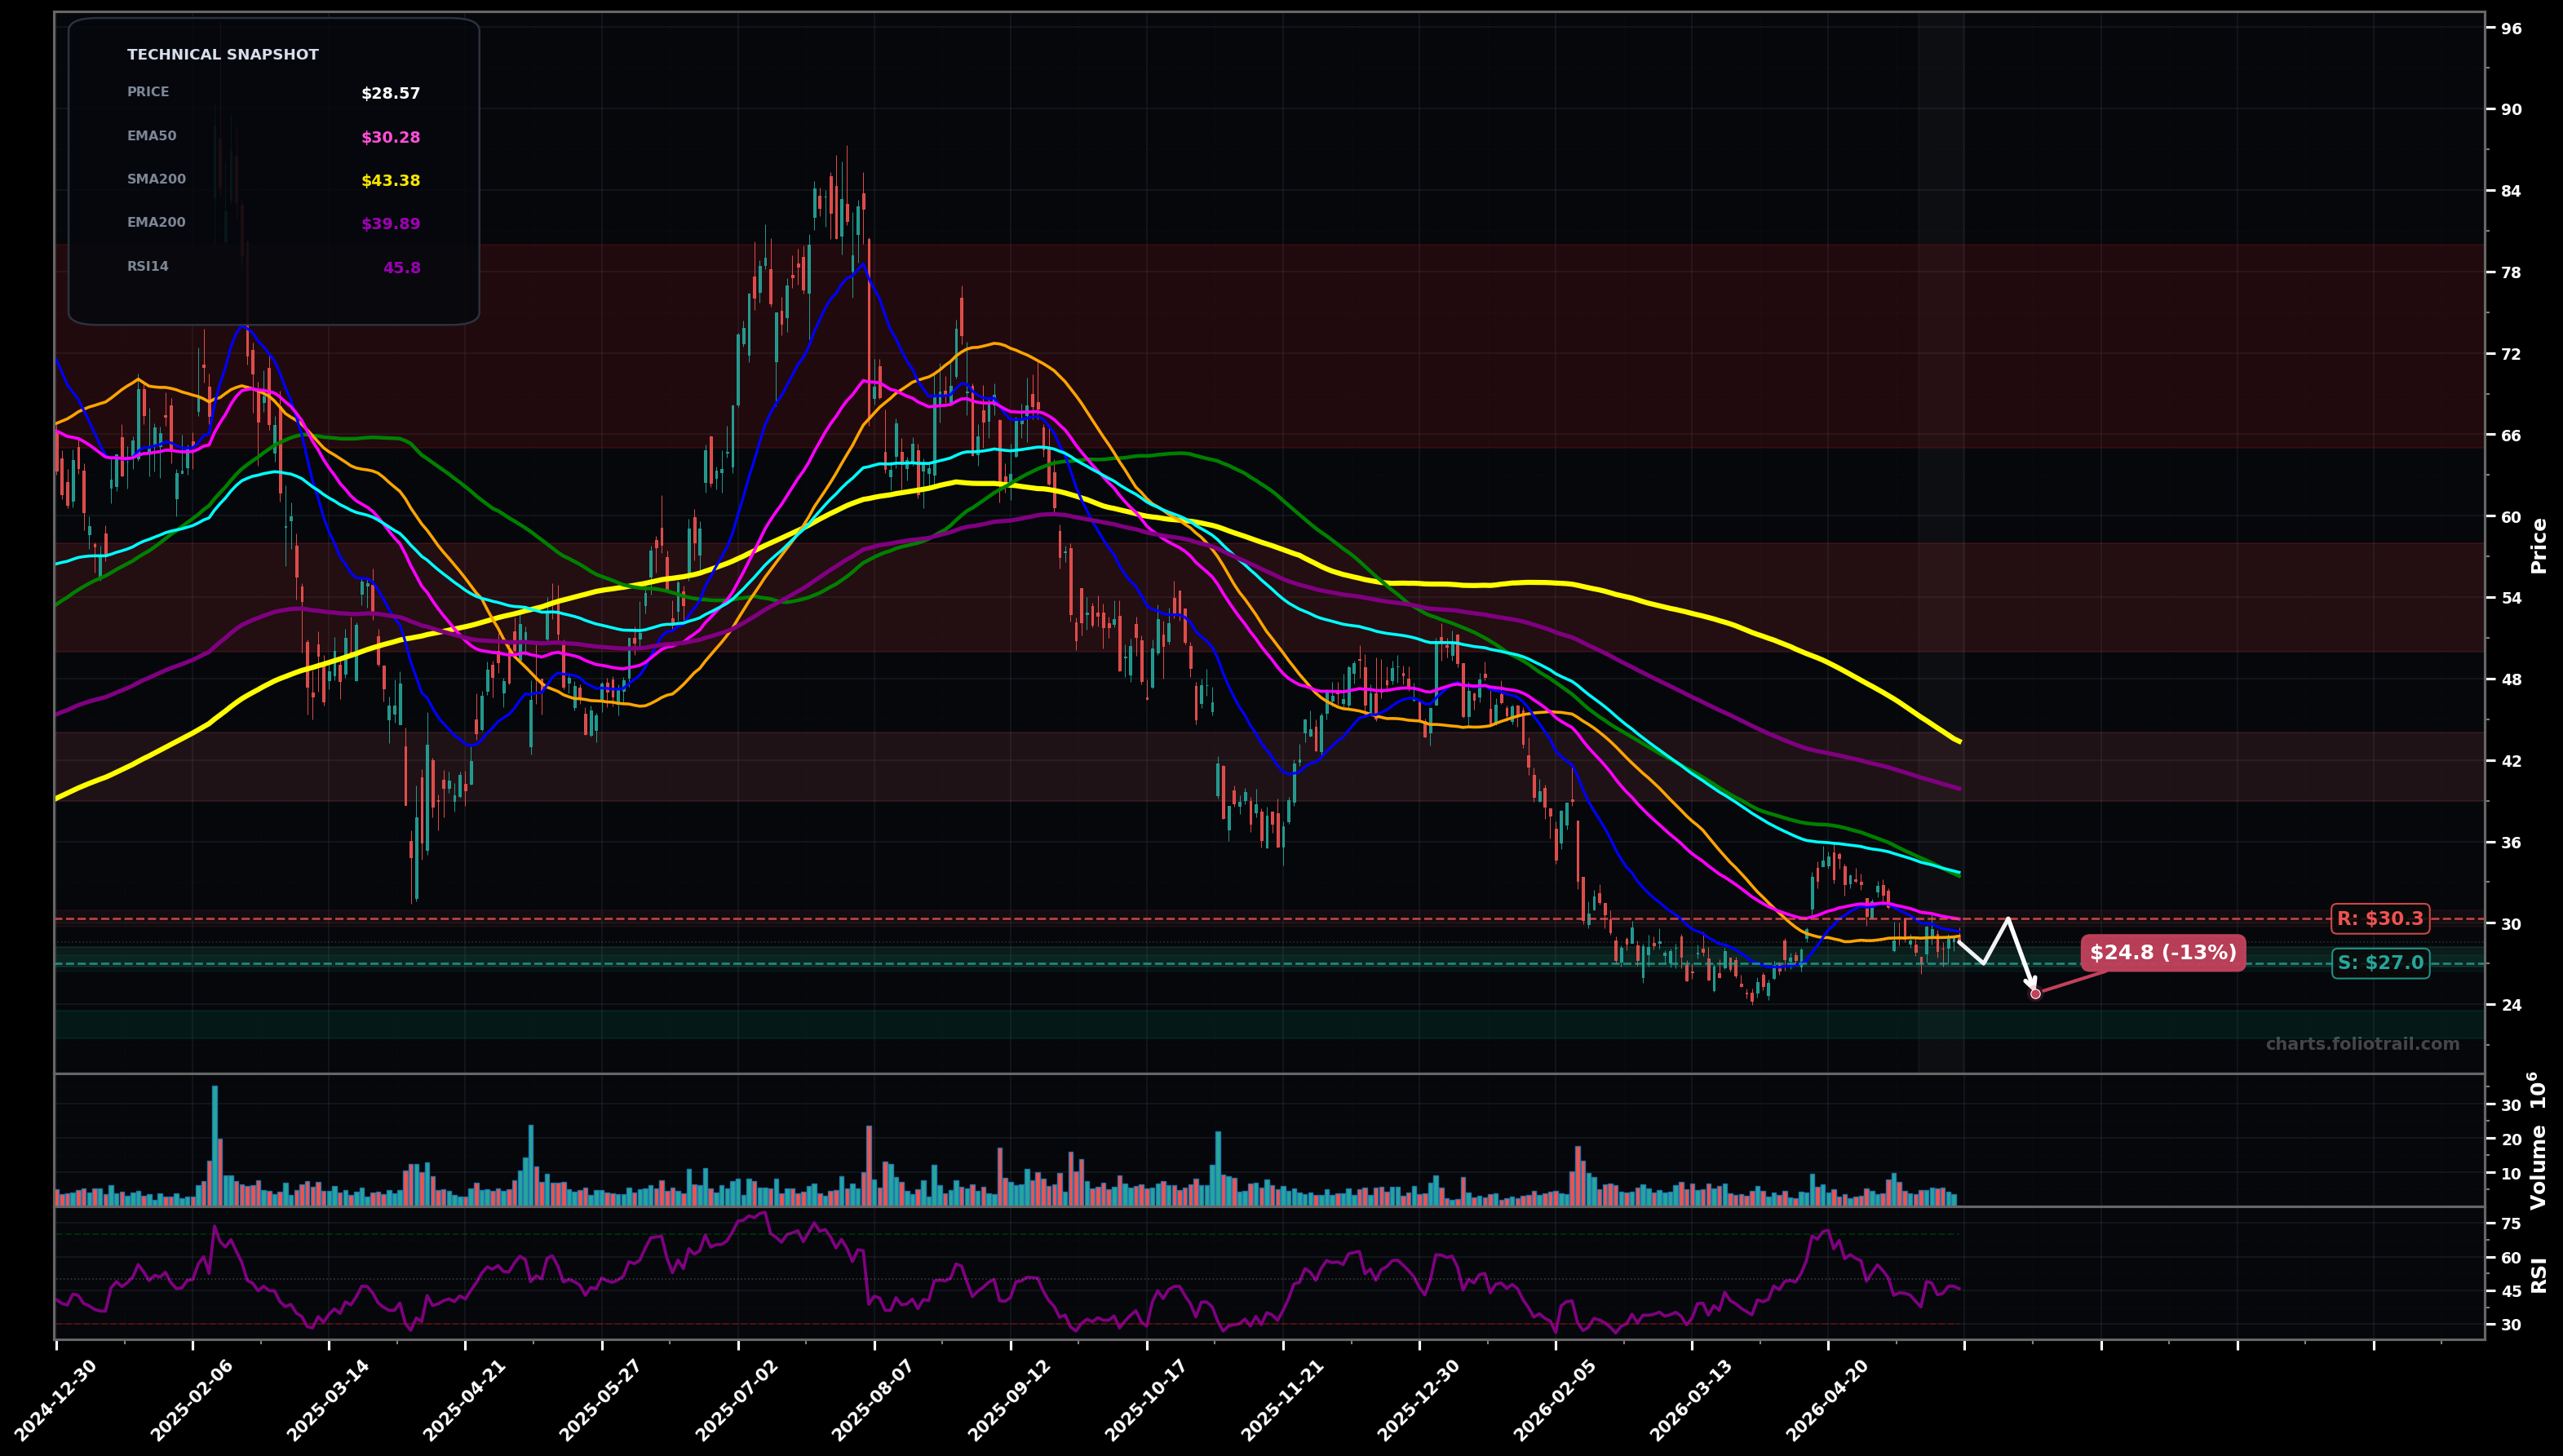
As of May 22, 2026, UPST (Upstart Holdings, Inc.) is in a downtrend state on the daily chart, with a confidence level of 72%. Key support is at $27.0 and key resistance at $30.3. Price at ~$28.57 is consolidating near the lows after a long decline; trading below EMA50/EMA100 and under the SMA50 with RSI ~45 (weak/neutral bounce).
Most likely: sideways-to-lower grind; price gets rejected near the $30 area (EMA50/SMA50 zone) and revisits support, with risk of a breakdown to new/local lows.
Less likely: base breakout attempt; hold above $30 then push through the ~$33–$34 MA cluster (EMA100/SMA100) to trigger a larger mean-reversion rally toward the mid-$30s.
Daily close below $27.00 (breakdown under the recent base/range) confirms downtrend continuation.
Daily close above $33.70 (reclaim EMA100) would invalidate the current downtrend bias and shift toward reversal/base breakout.
Buy ranges are stacked around the current support breakdown line (~$27), then prior swing-low demand (~$24–$26), then a deeper capitulation zone where a larger Elliott-style Wave-5 flush could terminate (~$21.5–$23.5).
Trim into mean-reversion levels first (gap/MA magnet near ~$40s), then larger trims into prior distribution zones (~$50–$58), and full exits into a major retracement/previous supply band (~$65–$80) if a multi-year recovery wave plays out.
As of May 22, 2026, UPST (Upstart Holdings, Inc.) is in a downtrend state on the daily chart with 72% confidence. Price at ~$28.57 is consolidating near the lows after a long decline; trading below EMA50/EMA100 and under the SMA50 with RSI ~45 (weak/neutral bounce).
On the daily timeframe, UPST has key support at $27.0 and key resistance at $30.3. The most likely scenario (bearish) targets $27.0 and $24.8, with a revert level at $30.3.
UPST (Upstart Holdings, Inc.) is currently classified as downtrend on the daily chart, with 72% confidence. Confirmation requires: Daily close below $27.00 (breakdown under the recent base/range) confirms downtrend continuation. This would be invalidated by: Daily close above $33.70 (reclaim EMA100) would invalidate the current downtrend bias and shift toward reversal/base breakout.
The most likely scenario (bearish) targets $27.0 and $24.8, with a revert level at $30.3. The alternative scenario (bullish) targets $33.7 and $39.9.
Multi-layer AI agents analyse 200+ stocks across daily, weekly, and monthly timeframes — producing market state classifications, price scenarios with targets, and position entry/exit levels. Daily charts updated every trading day at 6 PM ET. Weekly charts refresh Fridays. Monthly charts refresh on the last trading day of each month. No paywall. No sign-up required.
Built by Foliotrail.
All content on this website — including charts, analysis, price targets, support/resistance levels, and position zones — is generated entirely by AI and provided for educational and informational purposes only.
This is not financial advice. NEXUSNOIR VENTURES SL (the operator of this website) is not a registered investment adviser or broker-dealer. You should not make investment decisions based solely on this information. Always do your own research and consult a qualified financial advisor.
By continuing, you acknowledge that you have read and agree to our full disclaimer & terms of use and privacy policy.