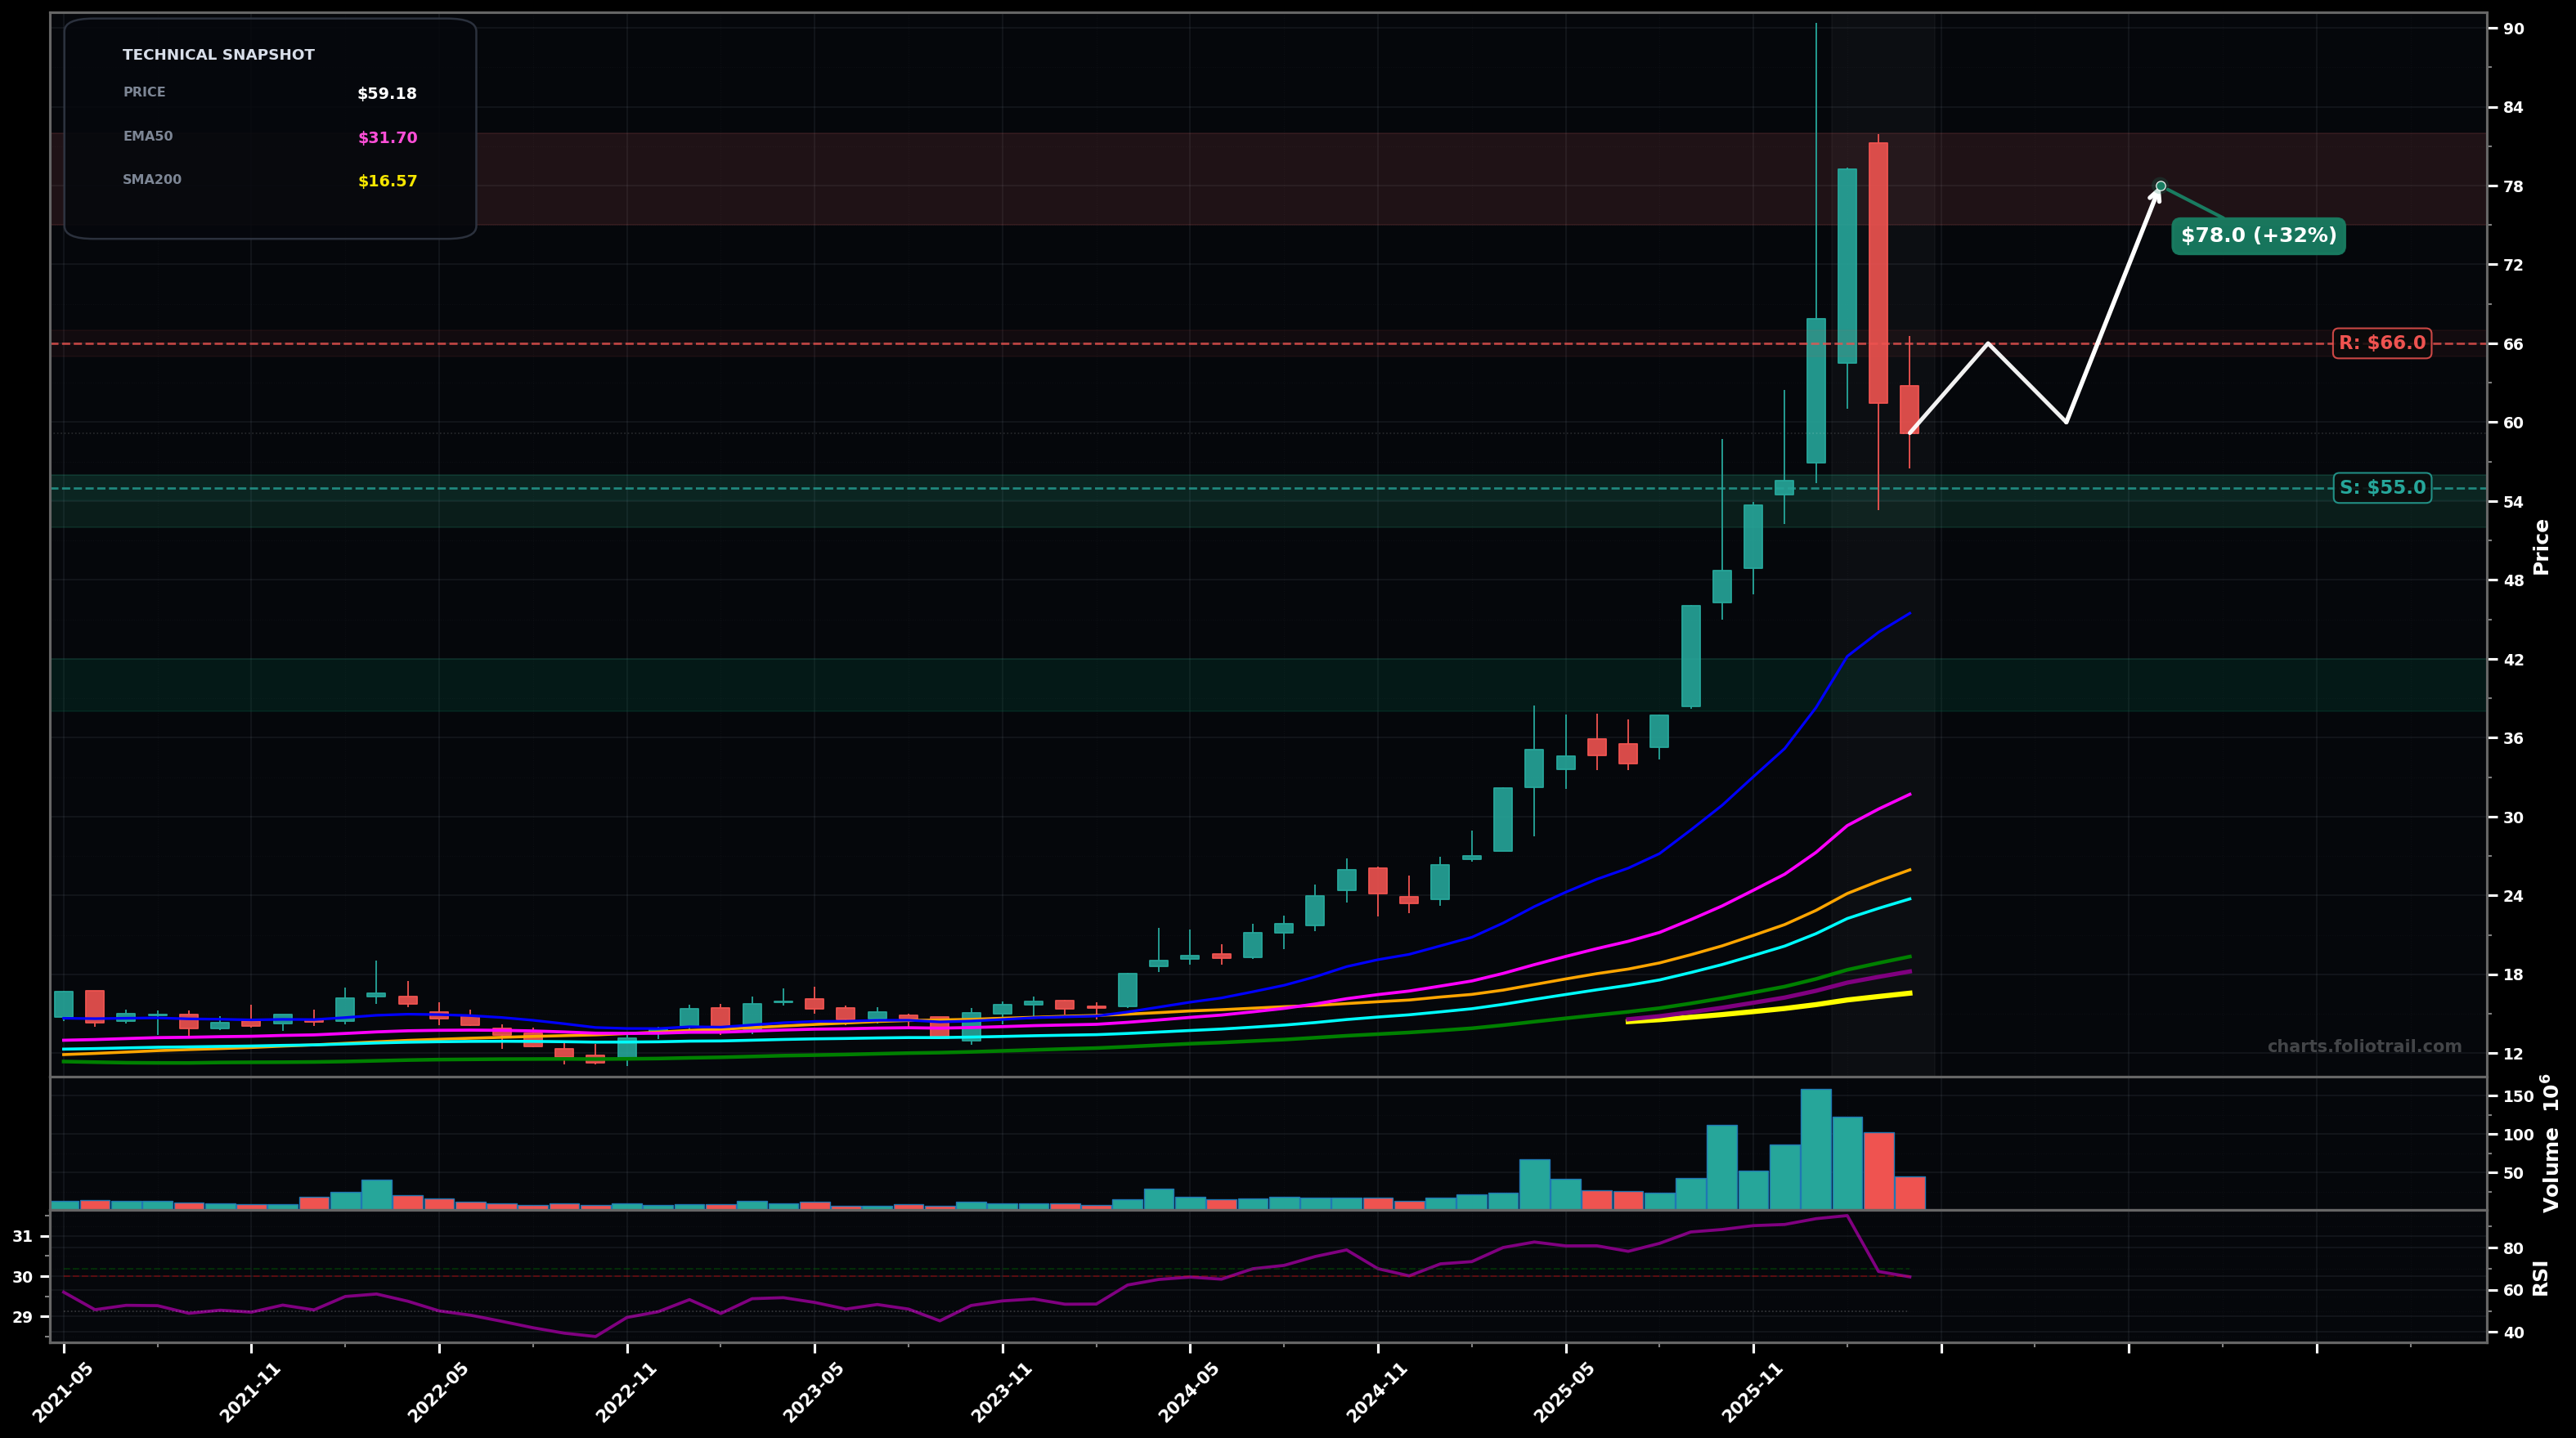
As of April 30, 2026, UGL (ProShares Ultra Gold) is in a volatility expansion state on the monthly chart, with a confidence level of 72%. Key support is at $55.0 and key resistance at $66.0. After a vertical run to ~$85-$90, UGL pulled back on 2 red monthly candles and is now holding around $59.18, still well above all key EMAs/SMAs (RSI-14 ~66).
Controlled pullback/consolidation: price bases between prior breakout area and psychological $60, then attempts a trend resumption; fits an Elliott Wave view of a Wave 4 consolidation after an extended Wave 3 blow-off, with Fib support likely around the 0.382-0.50 retrace zone of the last impulse.
Deeper mean-reversion: the post-spike pullback extends into a larger ABC correction (or deeper Wave 4), fading the blow-off move and retracing toward the rising EMA50/structure; this would be a larger Fib retrace (0.50-0.618) of the run into the highs.
Volatility-expansion continues if price breaks and closes below $55.00 on a monthly basis.
State shifts to trend-resumption if price closes back above $66.00 and holds for 2 monthly closes.
Buy zones are set around the likely prior-breakout support ($55), then deeper Fib retrace/structure ($50), with heavy adds near a larger retrace and closer to the rising EMA20/EMA50 magnet zone ($40s).
Trim into prior blow-off supply ($80s) and the spike-high region ($85-$90); fully exit only if a new euphoric extension prints well beyond prior highs (high risk of multi-year mean reversion after parabolic legs).
As of April 30, 2026, UGL (ProShares Ultra Gold) is in a volatility expansion state on the monthly chart with 72% confidence. After a vertical run to ~$85-$90, UGL pulled back on 2 red monthly candles and is now holding around $59.18, still well above all key EMAs/SMAs (RSI-14 ~66).
On the monthly timeframe, UGL has key support at $55.0 and key resistance at $66.0. The most likely scenario (bullish) targets $66.0 and $78.0, with a revert level at $60.0.
UGL (ProShares Ultra Gold) is currently classified as volatility expansion on the monthly chart, with 72% confidence. Confirmation requires: Volatility-expansion continues if price breaks and closes below $55.00 on a monthly basis. This would be invalidated by: State shifts to trend-resumption if price closes back above $66.00 and holds for 2 monthly closes.
The most likely scenario (bullish) targets $66.0 and $78.0, with a revert level at $60.0. The alternative scenario (bearish) targets $50.0 and $42.0.
Multi-layer AI agents analyse 200+ stocks across daily, weekly, and monthly timeframes — producing market state classifications, price scenarios with targets, and position entry/exit levels. Daily charts updated every trading day at 6 PM ET. Weekly charts refresh Fridays. Monthly charts refresh on the last trading day of each month. No paywall. No sign-up required.
Built by Foliotrail.
All content on this website — including charts, analysis, price targets, support/resistance levels, and position zones — is generated entirely by AI and provided for educational and informational purposes only.
This is not financial advice. NEXUSNOIR VENTURES SL (the operator of this website) is not a registered investment adviser or broker-dealer. You should not make investment decisions based solely on this information. Always do your own research and consult a qualified financial advisor.
By continuing, you acknowledge that you have read and agree to our full disclaimer & terms of use and privacy policy.