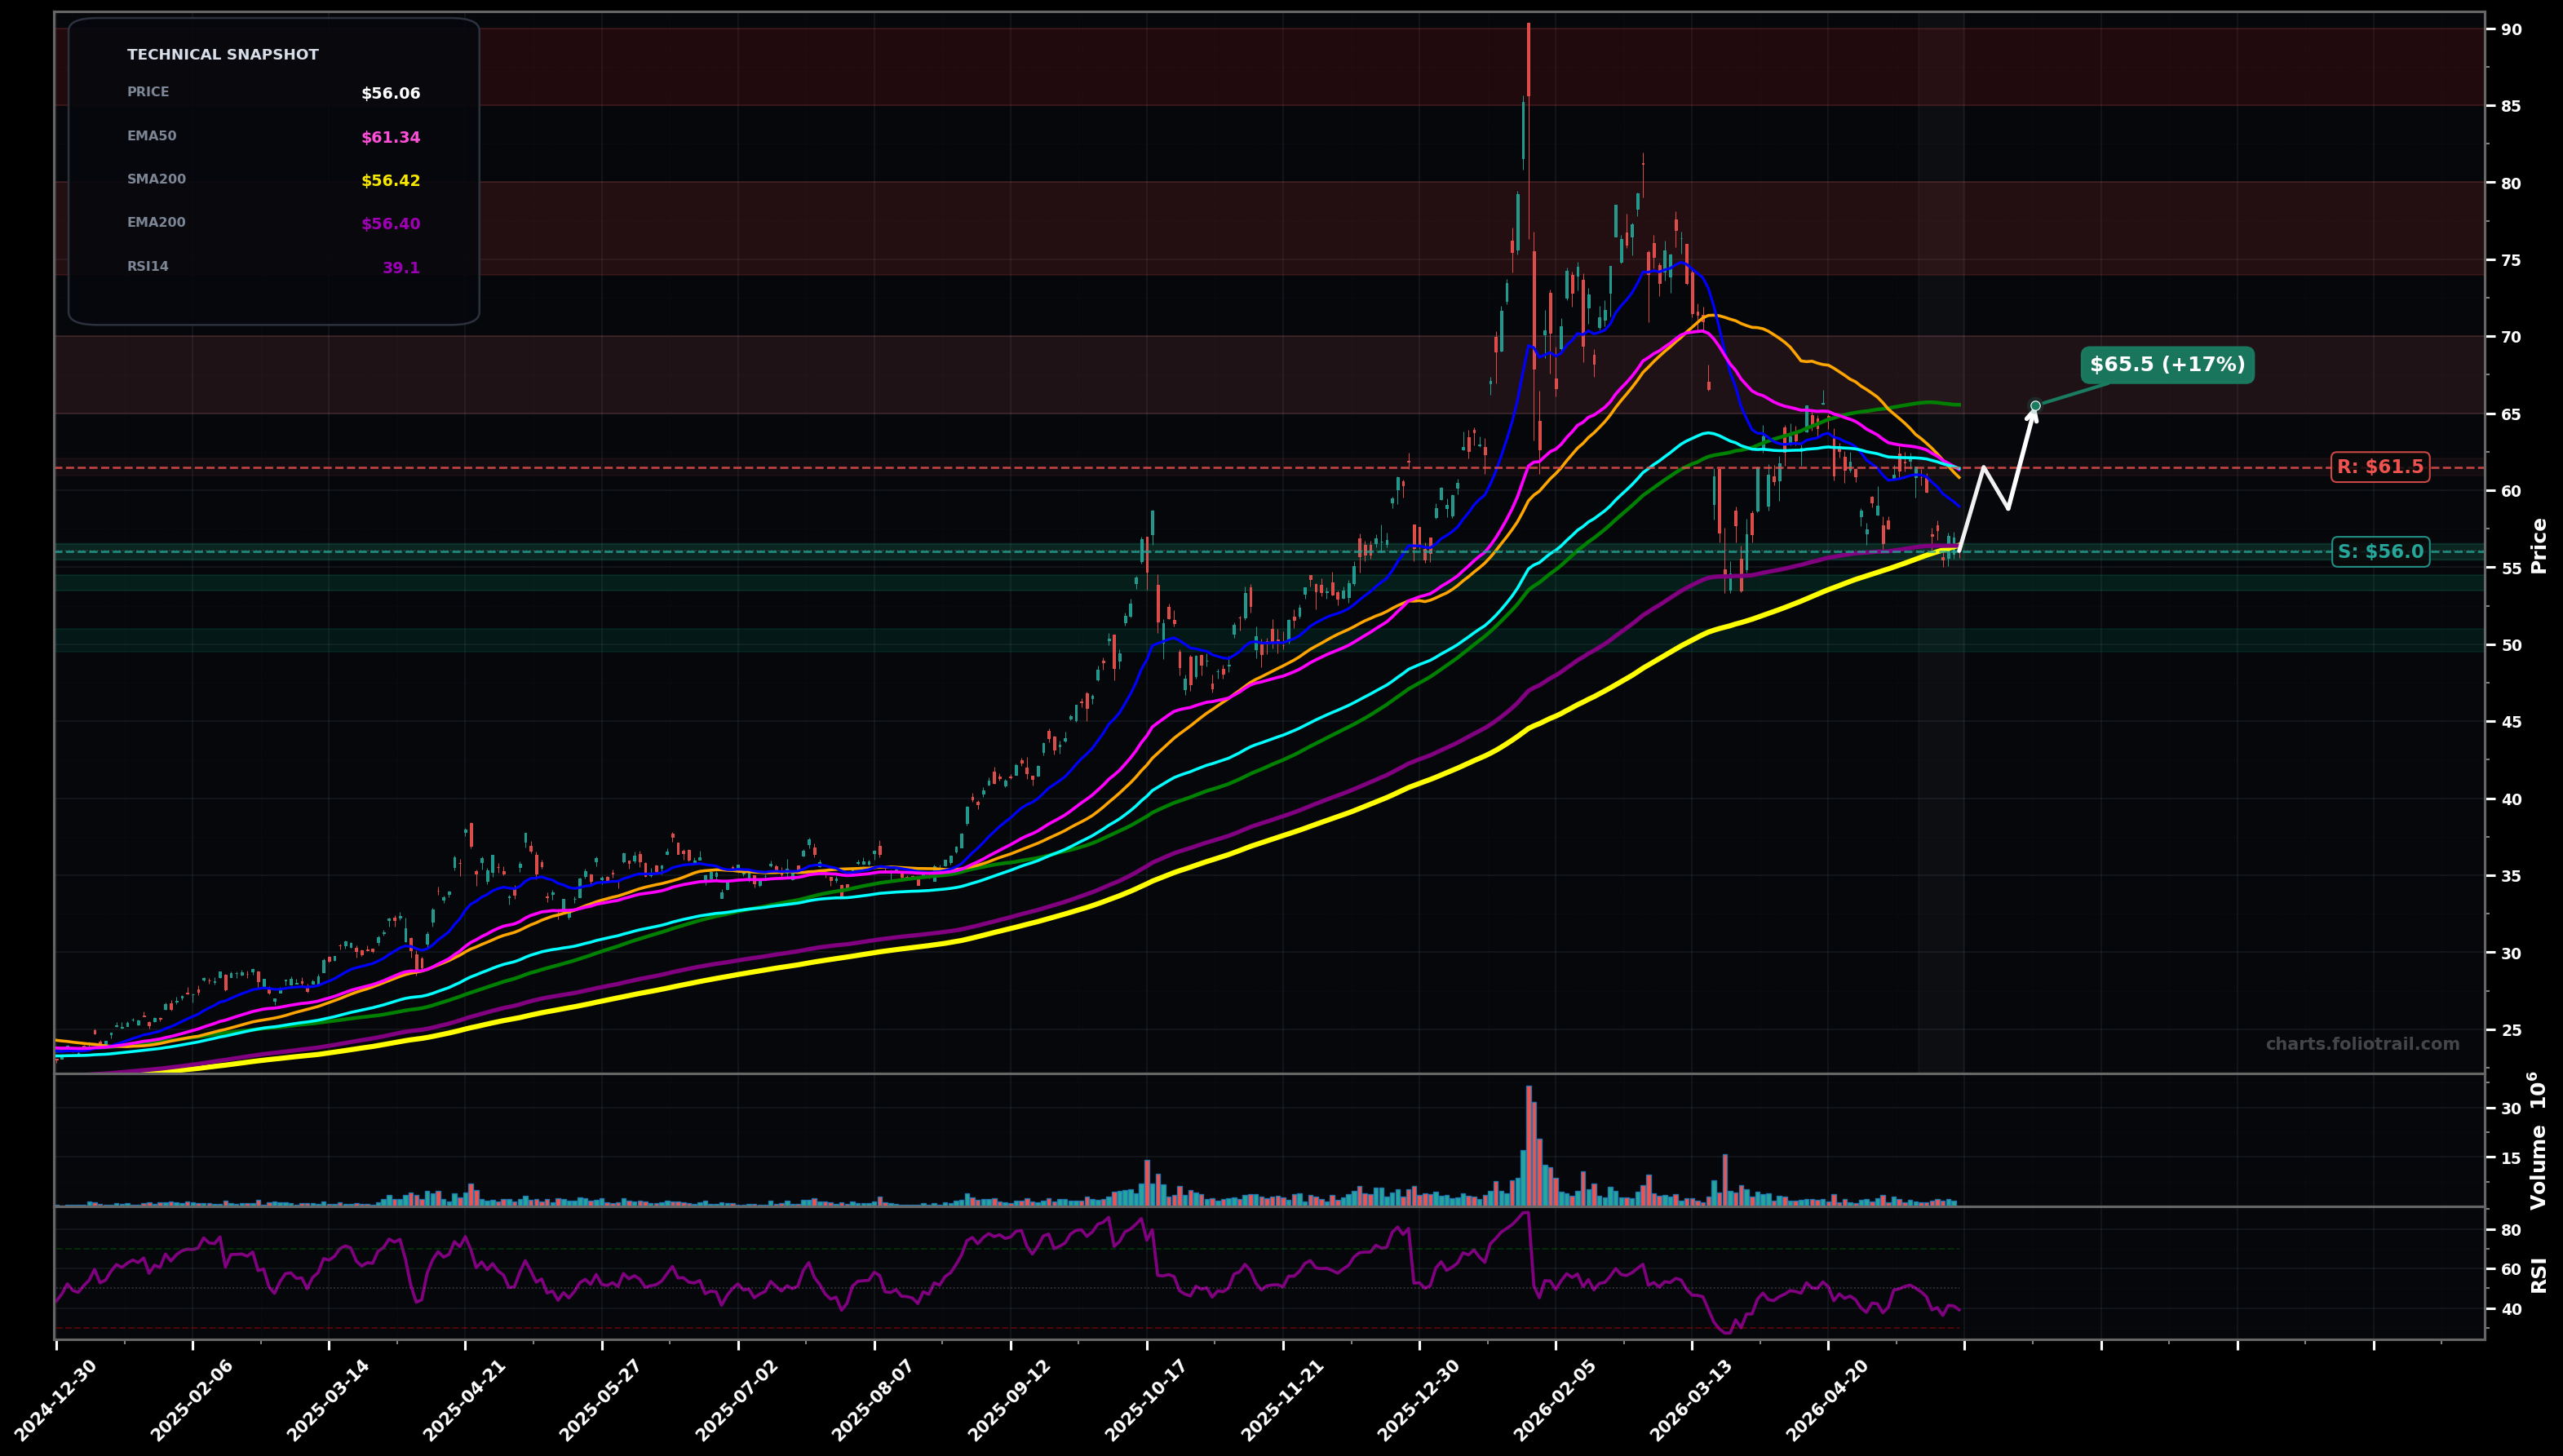
As of May 22, 2026, UGL (ProShares Ultra Gold) is in a downtrend state on the daily chart, with a confidence level of 72%. Key support is at $56.0 and key resistance at $61.5. Price at ~$56.06 is below EMA50/EMA100 (~$61.34/$61.42) and SMA50/100 (~$60.83/$65.55), testing the EMA200/SMA200 cluster (~$56.40/$56.42) after a series of lower highs since the ~$80+ peak; RSI ~39 shows weak momentum.
Base/defend the EMA200/SMA200 area (~$56) and attempt a mean-reversion bounce; first push targets the ~$61.5 reclaim zone, and if accepted, a larger retrace toward the prior breakdown supply near mid-$60s. (Elliott: likely finishing a corrective leg down; bounce would be a counter-trend wave within a larger correction.)
Lose the long-term MA cluster; breakdown below ~$55.5 triggers another impulse down toward the next demand zone, with a possible dead-cat bounce back to retest ~$56 before continuation. (Fib from ~$80 high to ~$54-$55 low area suggests room for an extension lower if $56 fails.)
Daily close below $55.50 (loss of the EMA200/SMA200 area) confirms trend continuation lower.
Two consecutive daily closes above $61.50 (reclaim EMA50/EMA100) invalidates the current downtrend bias.
Layer around the EMA200/SMA200 pivot (~$56) first; add on confirmed breakdown into next support (~$54), heavy add only at deeper capitulation/value zone (~$50) if downside scenario plays out.
Trim into prior supply/failed-rally zones (mid-$60s then upper-$70s) and exit into a full retest/overthrow of the prior spike area (~$85-$90) where upside becomes most stretched.
As of May 22, 2026, UGL (ProShares Ultra Gold) is in a downtrend state on the daily chart with 72% confidence. Price at ~$56.06 is below EMA50/EMA100 (~$61.34/$61.42) and SMA50/100 (~$60.83/$65.55), testing the EMA200/SMA200 cluster (~$56.40/$56.42) after a series of lower highs since the ~$80+ peak; RSI ~39 shows weak momentum.
On the daily timeframe, UGL has key support at $56.0 and key resistance at $61.5. The most likely scenario (bullish) targets $61.5 and $65.5, with a revert level at $58.8.
UGL (ProShares Ultra Gold) is currently classified as downtrend on the daily chart, with 72% confidence. Confirmation requires: Daily close below $55.50 (loss of the EMA200/SMA200 area) confirms trend continuation lower. This would be invalidated by: Two consecutive daily closes above $61.50 (reclaim EMA50/EMA100) invalidates the current downtrend bias.
The most likely scenario (bullish) targets $61.5 and $65.5, with a revert level at $58.8. The alternative scenario (bearish) targets $54.0 and $50.0.
Multi-layer AI agents analyse 200+ stocks across daily, weekly, and monthly timeframes — producing market state classifications, price scenarios with targets, and position entry/exit levels. Daily charts updated every trading day at 6 PM ET. Weekly charts refresh Fridays. Monthly charts refresh on the last trading day of each month. No paywall. No sign-up required.
Built by Foliotrail.
All content on this website — including charts, analysis, price targets, support/resistance levels, and position zones — is generated entirely by AI and provided for educational and informational purposes only.
This is not financial advice. NEXUSNOIR VENTURES SL (the operator of this website) is not a registered investment adviser or broker-dealer. You should not make investment decisions based solely on this information. Always do your own research and consult a qualified financial advisor.
By continuing, you acknowledge that you have read and agree to our full disclaimer & terms of use and privacy policy.