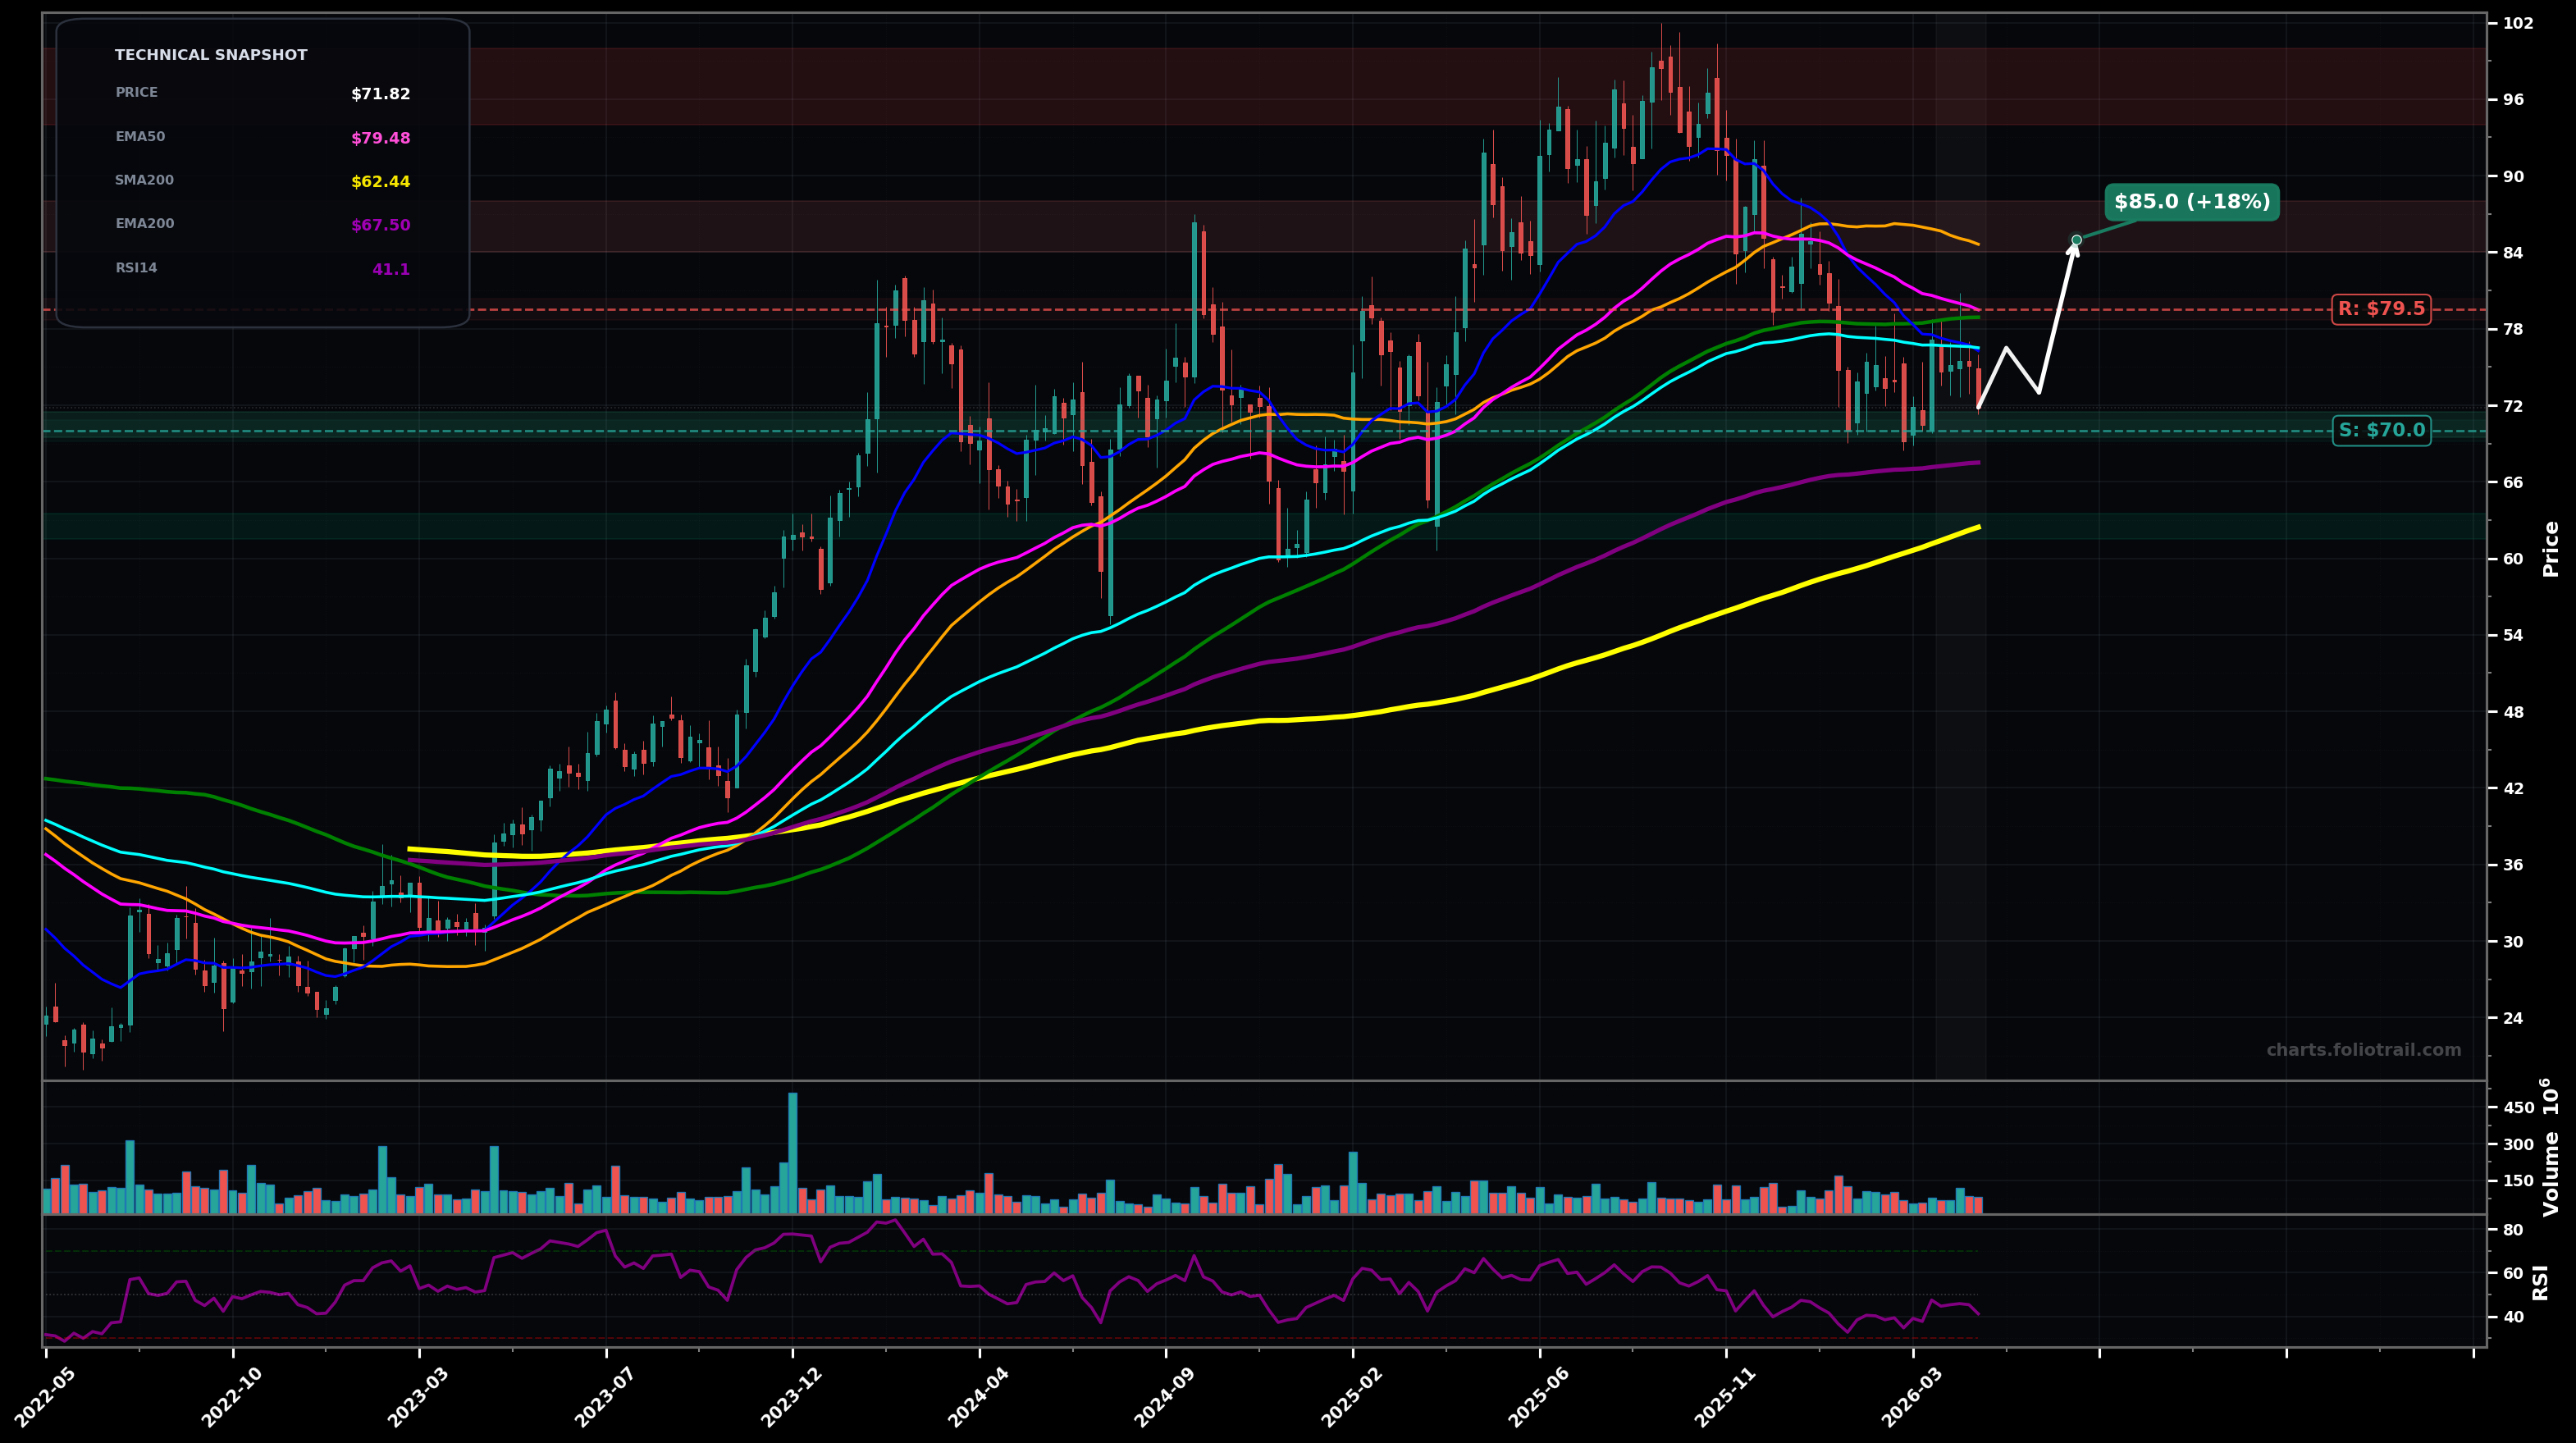
As of May 22, 2026, UBER (Uber Technologies, Inc.) is in a downtrend state on the weekly chart, with a confidence level of 66%. Key support is at $70.0 and key resistance at $79.5. Weekly downshift from the $100 peak into a tight $70–$78 chop; price ($71.82) sits below EMA50 ($79.48) & EMA100 ($76.50) with RSI-14 ~41 (weak momentum) while still above rising SMA200 ($62.44).
Base-building above $70 then reclaim of EMA100/EMA50 leads to a mean-reversion rally into the $84–$86 supply zone (SMA50/overhead structure), with a possible retest of the breakout area first.
Failure to hold $70 breaks the range and triggers a continuation leg down toward the rising long-term supports (EMA200/SMA200 zone), consistent with a larger Elliott Wave corrective C/3-down extension.
Weekly close below $70.00
2 consecutive weekly closes above $79.50
Scale near range support ($70) first; add on breakdown/retest into EMA200 (~$67.5); heavy add near SMA200 (~$62.4) where multi-quarter trend support typically attracts buyers.
Trim into the MA/structure overhead ($84–$88), more into prior-cycle supply near the $94–$100 peak, and fully exit only on an extended 1.618-style upside overshoot above prior ATH zone.
As of May 22, 2026, UBER (Uber Technologies, Inc.) is in a downtrend state on the weekly chart with 66% confidence. Weekly downshift from the $100 peak into a tight $70–$78 chop; price ($71.82) sits below EMA50 ($79.48) & EMA100 ($76.50) with RSI-14 ~41 (weak momentum) while still above rising SMA200 ($62.44).
On the weekly timeframe, UBER has key support at $70.0 and key resistance at $79.5. The most likely scenario (bullish) targets $76.5 and $85.0, with a revert level at $73.0.
UBER (Uber Technologies, Inc.) is currently classified as downtrend on the weekly chart, with 66% confidence. Confirmation requires: Weekly close below $70.00 This would be invalidated by: 2 consecutive weekly closes above $79.50
The most likely scenario (bullish) targets $76.5 and $85.0, with a revert level at $73.0. The alternative scenario (bearish) targets $67.5 and $62.5.
Multi-layer AI agents analyse 200+ stocks across daily, weekly, and monthly timeframes — producing market state classifications, price scenarios with targets, and position entry/exit levels. Daily charts updated every trading day at 6 PM ET. Weekly charts refresh Fridays. Monthly charts refresh on the last trading day of each month. No paywall. No sign-up required.
Built by Foliotrail.
All content on this website — including charts, analysis, price targets, support/resistance levels, and position zones — is generated entirely by AI and provided for educational and informational purposes only.
This is not financial advice. NEXUSNOIR VENTURES SL (the operator of this website) is not a registered investment adviser or broker-dealer. You should not make investment decisions based solely on this information. Always do your own research and consult a qualified financial advisor.
By continuing, you acknowledge that you have read and agree to our full disclaimer & terms of use and privacy policy.