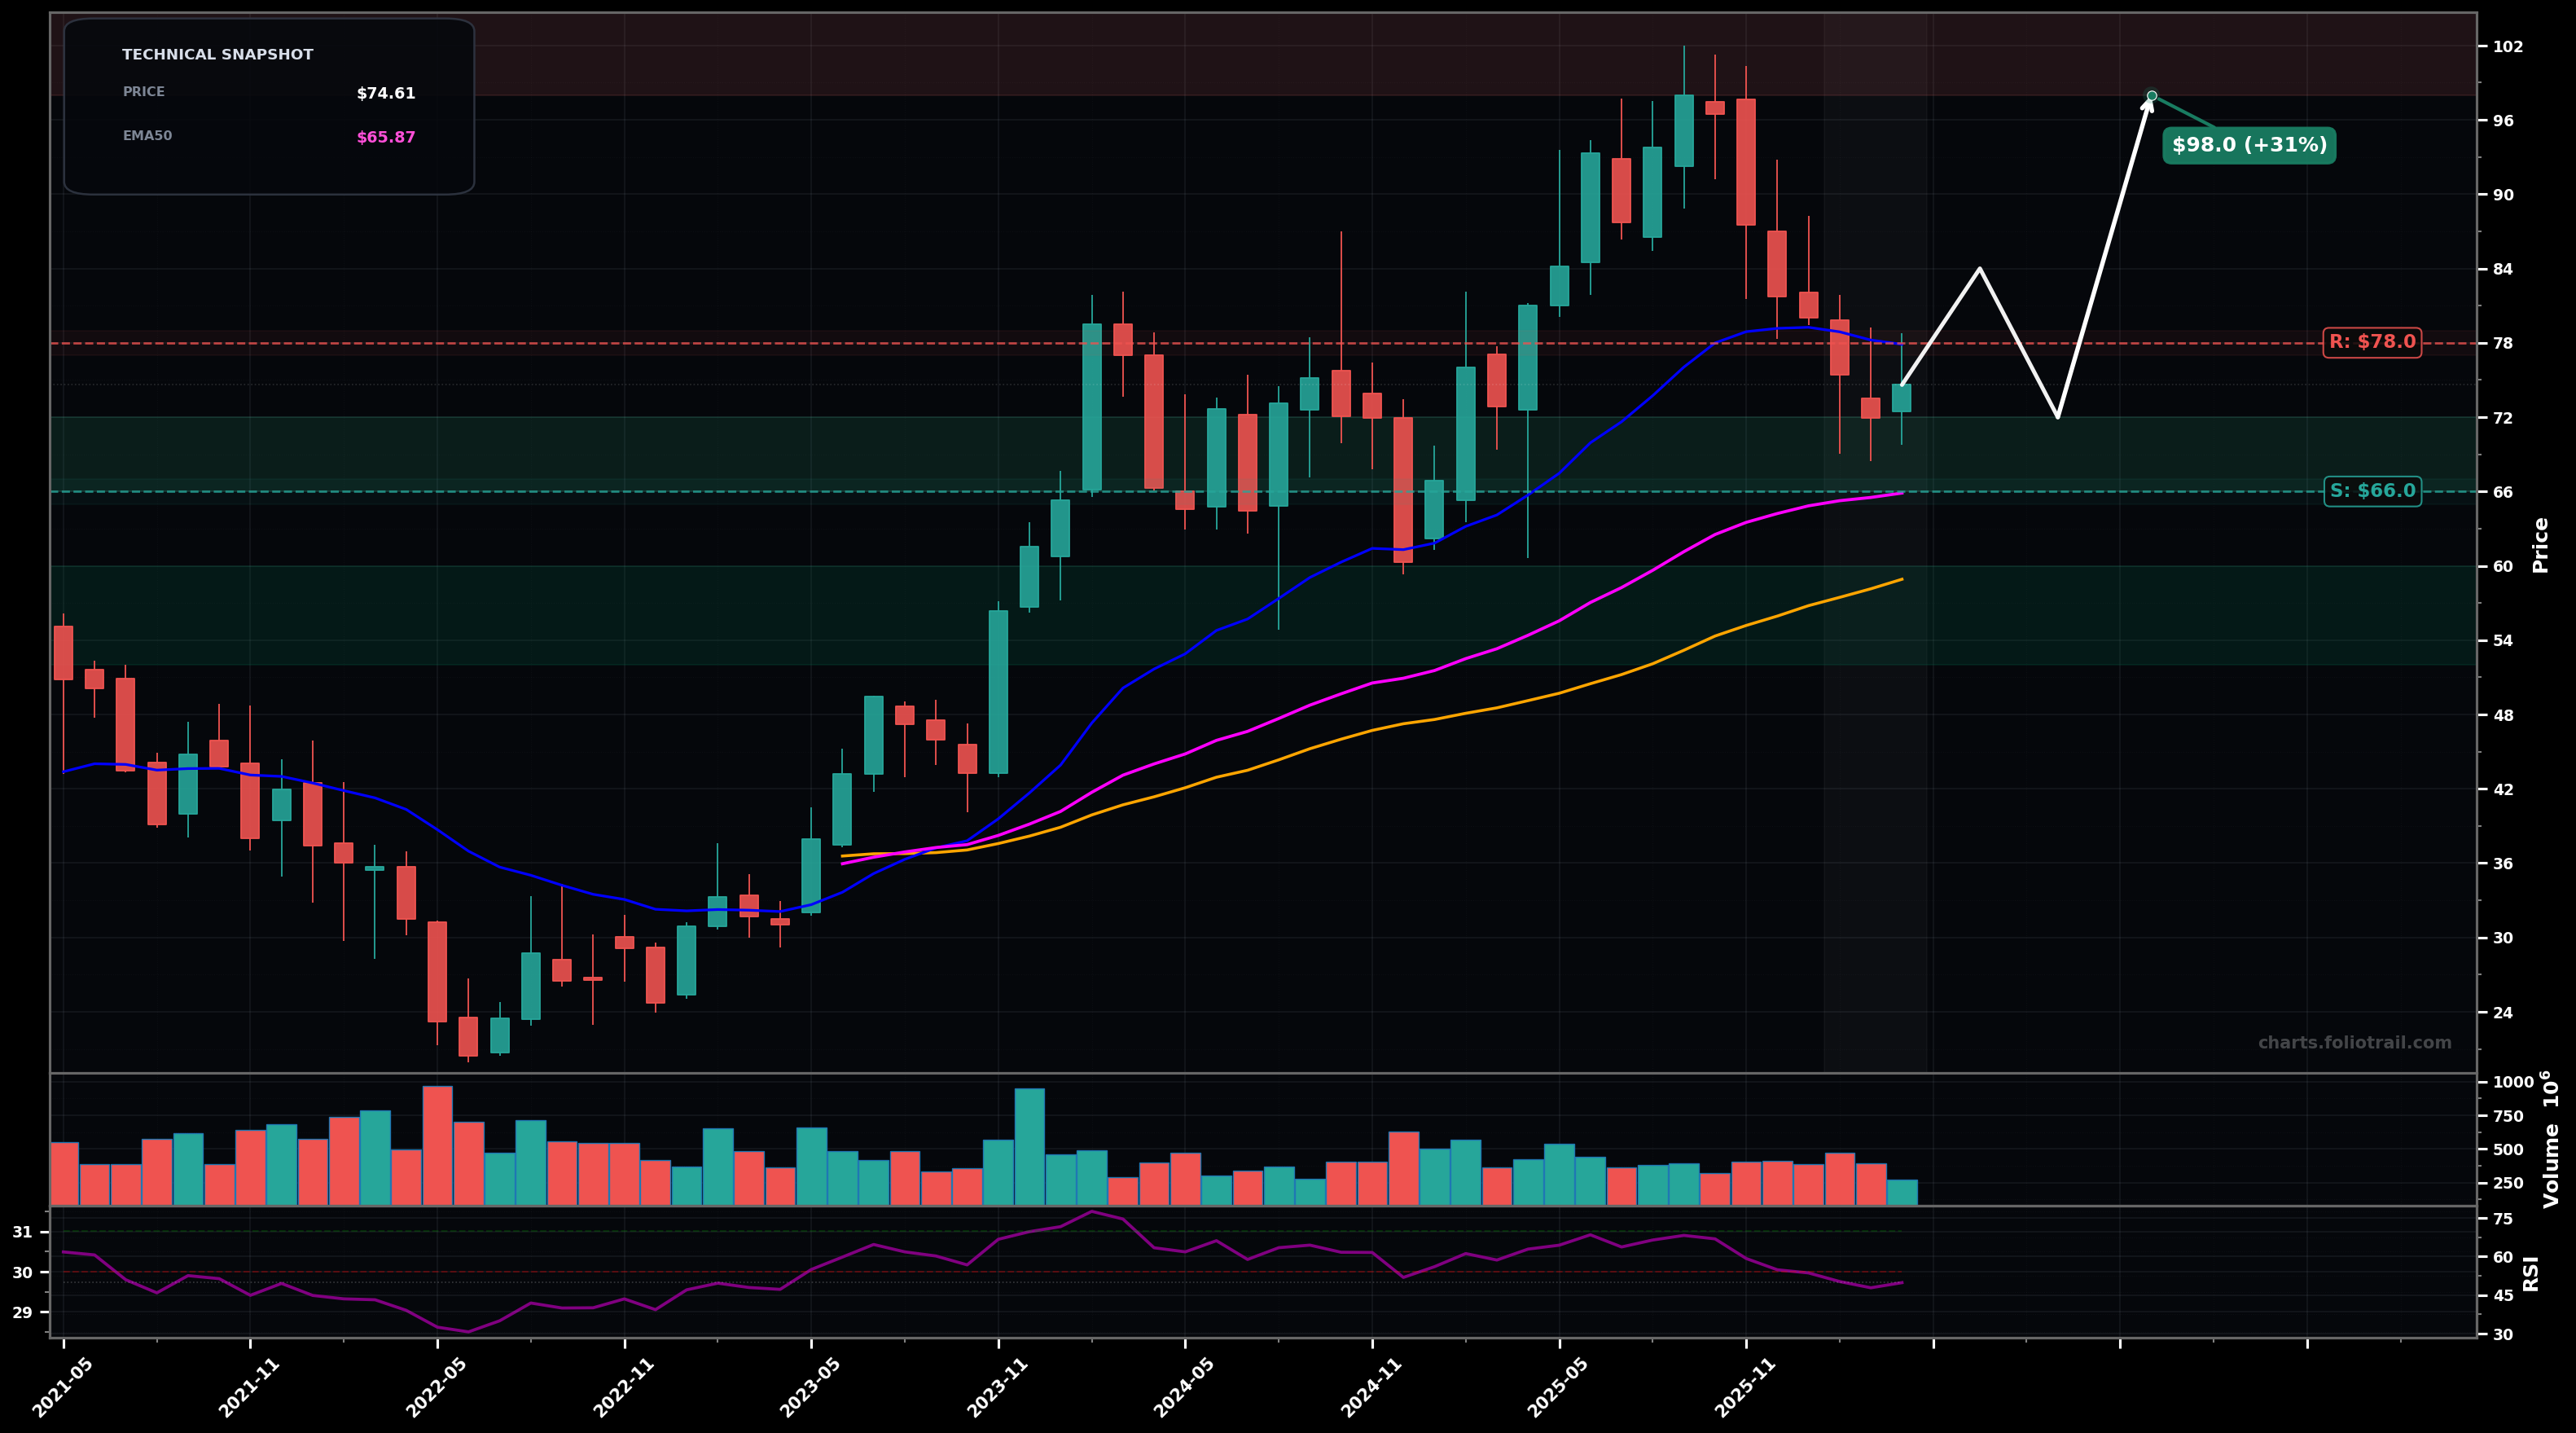
As of April 30, 2026, UBER (Uber Technologies, Inc.) is in a uptrend state on the monthly chart, with a confidence level of 62%. Key support is at $66.0 and key resistance at $78.0. Monthly pullback from the ~$100 peak into the mid-$70s; price is still above the rising EMA50 (pink) and SMA50 (orange) but below the faster EMA20; RSI ~50 (momentum reset).
Bullish continuation: the pullback is a Wave 4-type correction; price bases between ~$66–$78 then breaks back above the EMA20 zone and pushes toward the prior highs (Fib retrace of the ~$100→~$70 drop implies typical bounce targets).
Bearish deeper correction/base: loss of the EMA50 (pink) leads to a larger Wave 4 / ABC into the higher-timeframe support cluster (prior breakout area + SMA50/round-number magnet), before attempting a new up-leg later.
Monthly close back above $78 (reclaim/hold above the fast MA zone) would confirm trend resumption
Monthly close below $65 would invalidate and shift bias toward a deeper correction/base
Scale bids around EMA50 (pink) ~$66 first; add on a clean breakdown into prior consolidation/$60; heavy add only if price mean-reverts toward the SMA50 (orange) and former breakout demand (~$52–$60).
Trim into prior ATH supply ($98–$110) and any Wave-5 extension; heavier trims if price accelerates far above rising EMA50/SMA50; close if a multi-year overextension/mania leg develops ($130+).
As of April 30, 2026, UBER (Uber Technologies, Inc.) is in a uptrend state on the monthly chart with 62% confidence. Monthly pullback from the ~$100 peak into the mid-$70s; price is still above the rising EMA50 (pink) and SMA50 (orange) but below the faster EMA20; RSI ~50 (momentum reset).
On the monthly timeframe, UBER has key support at $66.0 and key resistance at $78.0. The most likely scenario (bullish) targets $84.0 and $98.0, with a revert level at $72.0.
UBER (Uber Technologies, Inc.) is currently classified as uptrend on the monthly chart, with 62% confidence. Confirmation requires: Monthly close back above $78 (reclaim/hold above the fast MA zone) would confirm trend resumption This would be invalidated by: Monthly close below $65 would invalidate and shift bias toward a deeper correction/base
The most likely scenario (bullish) targets $84.0 and $98.0, with a revert level at $72.0. The alternative scenario (bearish) targets $60.0 and $52.0.
Multi-layer AI agents analyse 200+ stocks across daily, weekly, and monthly timeframes — producing market state classifications, price scenarios with targets, and position entry/exit levels. Daily charts updated every trading day at 6 PM ET. Weekly charts refresh Fridays. Monthly charts refresh on the last trading day of each month. No paywall. No sign-up required.
Built by Foliotrail.
All content on this website — including charts, analysis, price targets, support/resistance levels, and position zones — is generated entirely by AI and provided for educational and informational purposes only.
This is not financial advice. NEXUSNOIR VENTURES SL (the operator of this website) is not a registered investment adviser or broker-dealer. You should not make investment decisions based solely on this information. Always do your own research and consult a qualified financial advisor.
By continuing, you acknowledge that you have read and agree to our full disclaimer & terms of use and privacy policy.