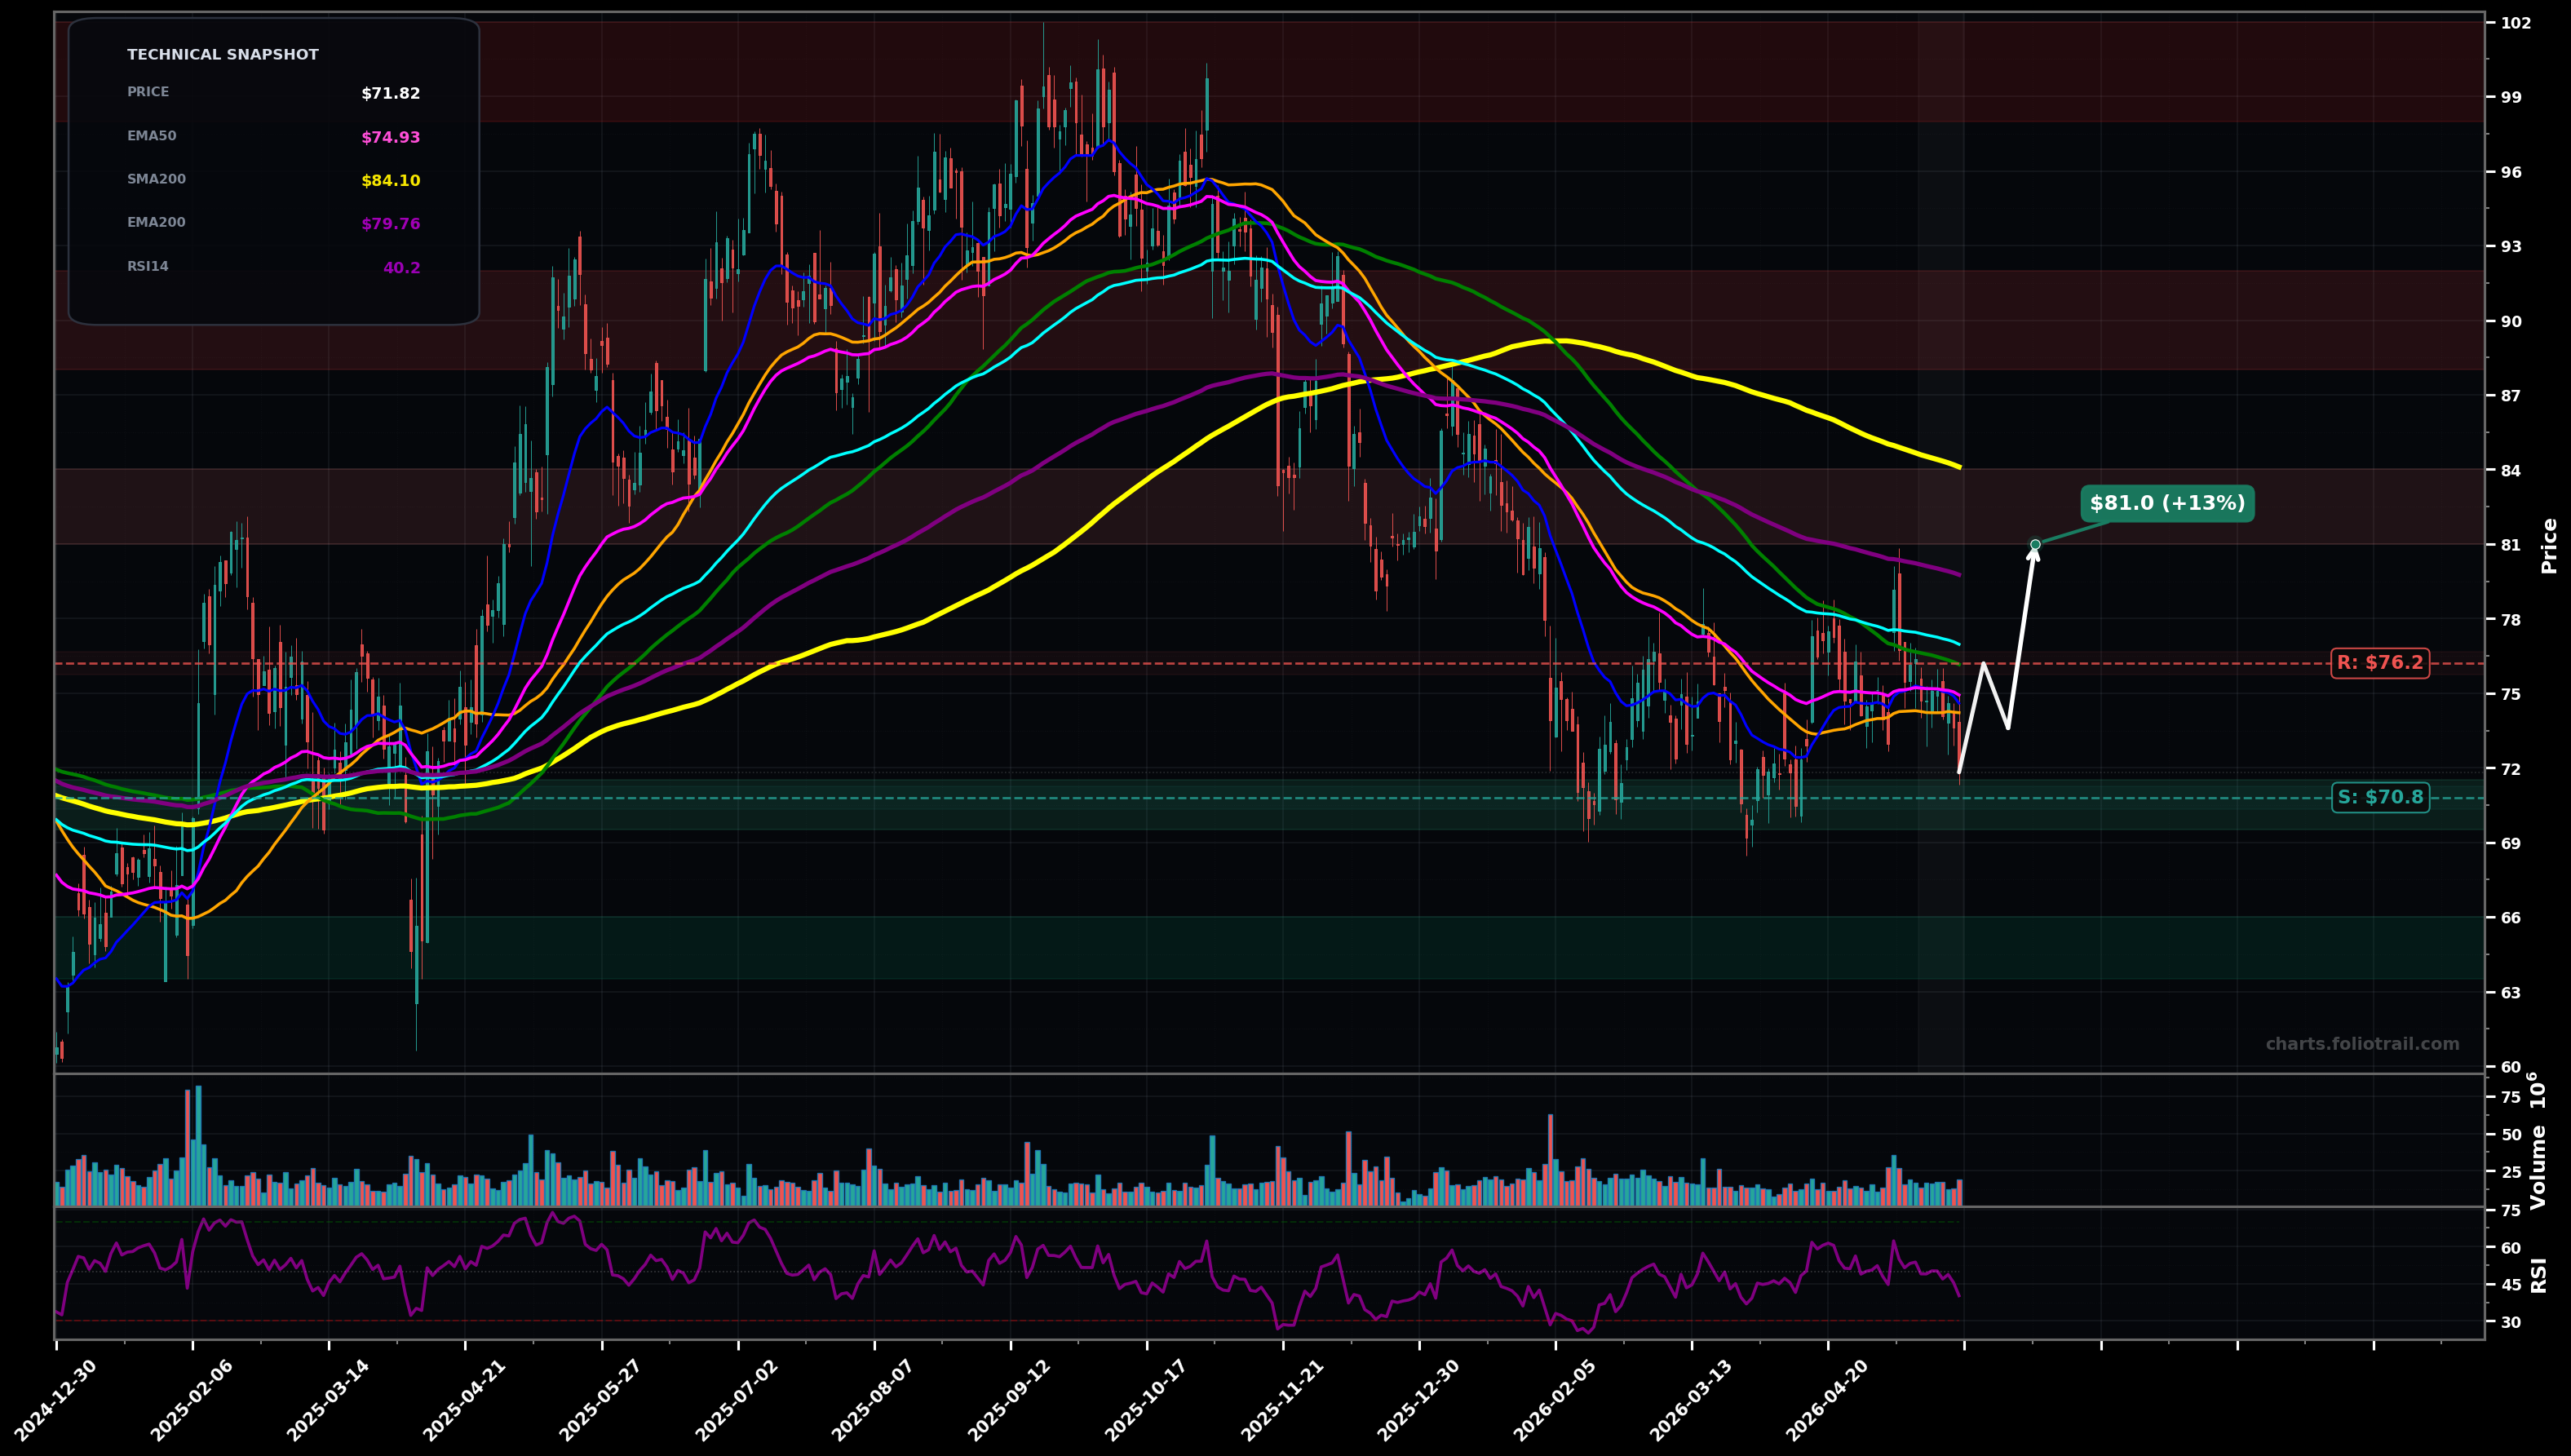
As of May 22, 2026, UBER (Uber Technologies, Inc.) is in a downtrend state on the daily chart, with a confidence level of 72%. Key support is at $70.8 and key resistance at $76.2. Price at ~$71.82 sold off back under the clustered short/mid MAs (SMA50/EMA50/EMA20 area) and is pressing the lower end of the recent range; RSI ~40 stays weak.
Base-building attempt: price holds the ~$70-$72 demand zone and mean-reverts toward the MA cluster; likely a corrective bounce (Elliott: wave (4) chop after a strong (3) down leg) with first resistance at the $75-$77 shelf. Fibonacci (rough from ~$100 high to ~$70 low): 23.6%~$77, 38.2%~$81 as upside checkpoints.
Trend continuation: loss of ~$70-$71 triggers another impulsive leg lower (Elliott: wave (5) extension risk), with price seeking the next demand band near prior pivots and psychological round levels; sellers likely defend any retest of the broken $72-$73 area.
Daily close below $70.80 (break under the range/lows) would confirm continued downtrend momentum.
Two daily closes back above $76.20 would invalidate near-term downtrend control (reclaim EMA100/SMA100 zone).
Scale near the swing-low support ($70-$72); add on breakdown/flush into next pivot zones; heavy add only if capitulation pushes price well below the range while watching for reversal candles and reclaim of EMA20/EMA50.
Trim into Fibonacci/MA confluence (38.2%~$81 and SMA200~$84), then stronger trims into prior distribution bands; close into the former major top supply near ~$100 where risk of a larger-degree rejection is highest.
As of May 22, 2026, UBER (Uber Technologies, Inc.) is in a downtrend state on the daily chart with 72% confidence. Price at ~$71.82 sold off back under the clustered short/mid MAs (SMA50/EMA50/EMA20 area) and is pressing the lower end of the recent range; RSI ~40 stays weak.
On the daily timeframe, UBER has key support at $70.8 and key resistance at $76.2. The most likely scenario (bullish) targets $76.2 and $81.0, with a revert level at $73.6.
UBER (Uber Technologies, Inc.) is currently classified as downtrend on the daily chart, with 72% confidence. Confirmation requires: Daily close below $70.80 (break under the range/lows) would confirm continued downtrend momentum. This would be invalidated by: Two daily closes back above $76.20 would invalidate near-term downtrend control (reclaim EMA100/SMA100 zone).
The most likely scenario (bullish) targets $76.2 and $81.0, with a revert level at $73.6. The alternative scenario (bearish) targets $68.0 and $64.5.
Multi-layer AI agents analyse 200+ stocks across daily, weekly, and monthly timeframes — producing market state classifications, price scenarios with targets, and position entry/exit levels. Daily charts updated every trading day at 6 PM ET. Weekly charts refresh Fridays. Monthly charts refresh on the last trading day of each month. No paywall. No sign-up required.
Built by Foliotrail.
All content on this website — including charts, analysis, price targets, support/resistance levels, and position zones — is generated entirely by AI and provided for educational and informational purposes only.
This is not financial advice. NEXUSNOIR VENTURES SL (the operator of this website) is not a registered investment adviser or broker-dealer. You should not make investment decisions based solely on this information. Always do your own research and consult a qualified financial advisor.
By continuing, you acknowledge that you have read and agree to our full disclaimer & terms of use and privacy policy.