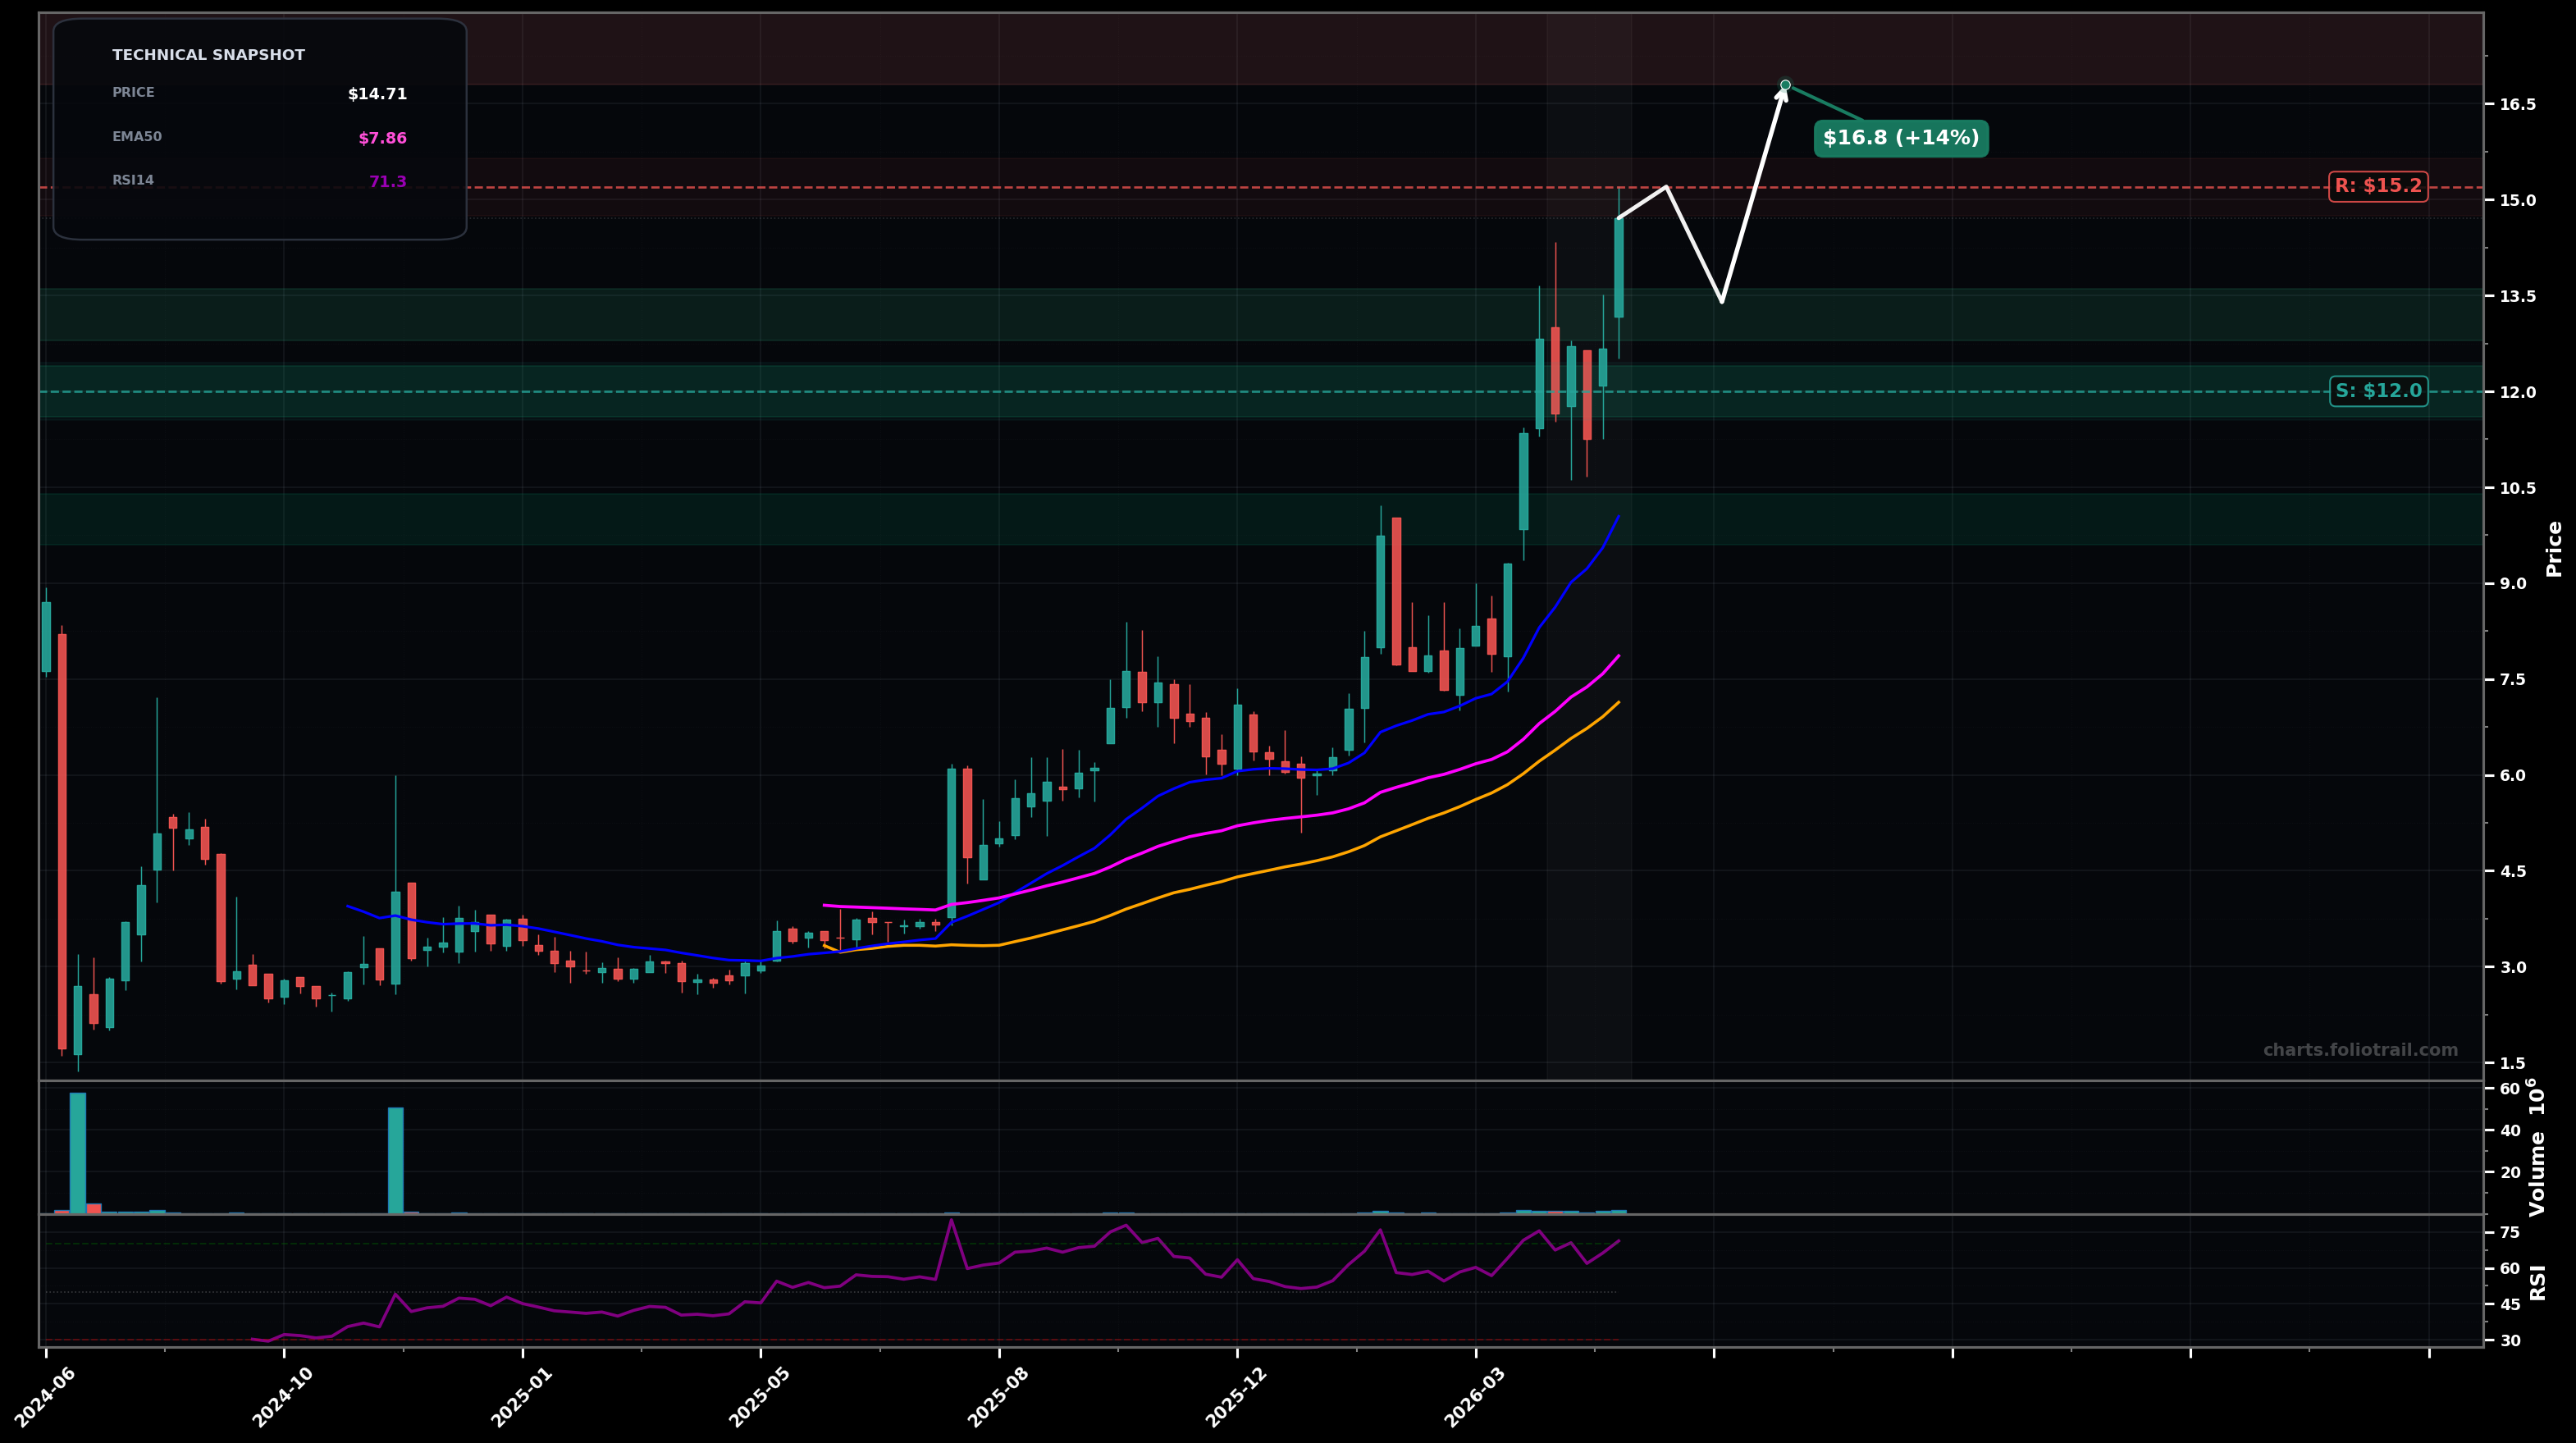
As of May 22, 2026, TOYO (Toyo Co., Ltd.) is in a uptrend state on the weekly chart, with a confidence level of 78%. Key support is at $12.0 and key resistance at $15.2. Weekly price at $14.71 pushed to fresh highs after a sharp impulse; candles are extended above rising EMA50/EMA100 with RSI ~$71 (near overbought).
Bullish continuation: brief consolidation/pullback into the prior breakout area (profit-taking) followed by another leg up (Elliott: likely wave 5 extension after a wave-4 pause).
Deeper mean-reversion: momentum cools (RSI high) and price retraces toward the rising EMA50/previous base before resuming trend (Elliott: larger wave 4).
Hold above $13.40 on a weekly closing basis (2+ weekly closes).
Weekly close below $11.70 (break of latest swing-low zone) shifts to distribution/range-risk.
Buy-the-dip zones align with prior breakout retest (~$13.4), then swing-low support (~$12), then EMA/structure confluence near ~$10 (deeper wave-4 style retrace).
Trim into Fibonacci extension-style upside after a multi-leg impulse (likely wave-5 stretch); higher zones assume price becomes increasingly detached from EMA50/100 and risk of sharp snapback rises.
As of May 22, 2026, TOYO (Toyo Co., Ltd.) is in a uptrend state on the weekly chart with 78% confidence. Weekly price at $14.71 pushed to fresh highs after a sharp impulse; candles are extended above rising EMA50/EMA100 with RSI ~$71 (near overbought).
On the weekly timeframe, TOYO has key support at $12.0 and key resistance at $15.2. The most likely scenario (bullish) targets $15.2 and $16.8, with a revert level at $13.4.
TOYO (Toyo Co., Ltd.) is currently classified as uptrend on the weekly chart, with 78% confidence. Confirmation requires: Hold above $13.40 on a weekly closing basis (2+ weekly closes). This would be invalidated by: Weekly close below $11.70 (break of latest swing-low zone) shifts to distribution/range-risk.
The most likely scenario (bullish) targets $15.2 and $16.8, with a revert level at $13.4. The alternative scenario (bearish) targets $12.0 and $10.1.
Multi-layer AI agents analyse 200+ stocks across daily, weekly, and monthly timeframes — producing market state classifications, price scenarios with targets, and position entry/exit levels. Daily charts updated every trading day at 6 PM ET. Weekly charts refresh Fridays. Monthly charts refresh on the last trading day of each month. No paywall. No sign-up required.
Built by Foliotrail.
All content on this website — including charts, analysis, price targets, support/resistance levels, and position zones — is generated entirely by AI and provided for educational and informational purposes only.
This is not financial advice. NEXUSNOIR VENTURES SL (the operator of this website) is not a registered investment adviser or broker-dealer. You should not make investment decisions based solely on this information. Always do your own research and consult a qualified financial advisor.
By continuing, you acknowledge that you have read and agree to our full disclaimer & terms of use and privacy policy.