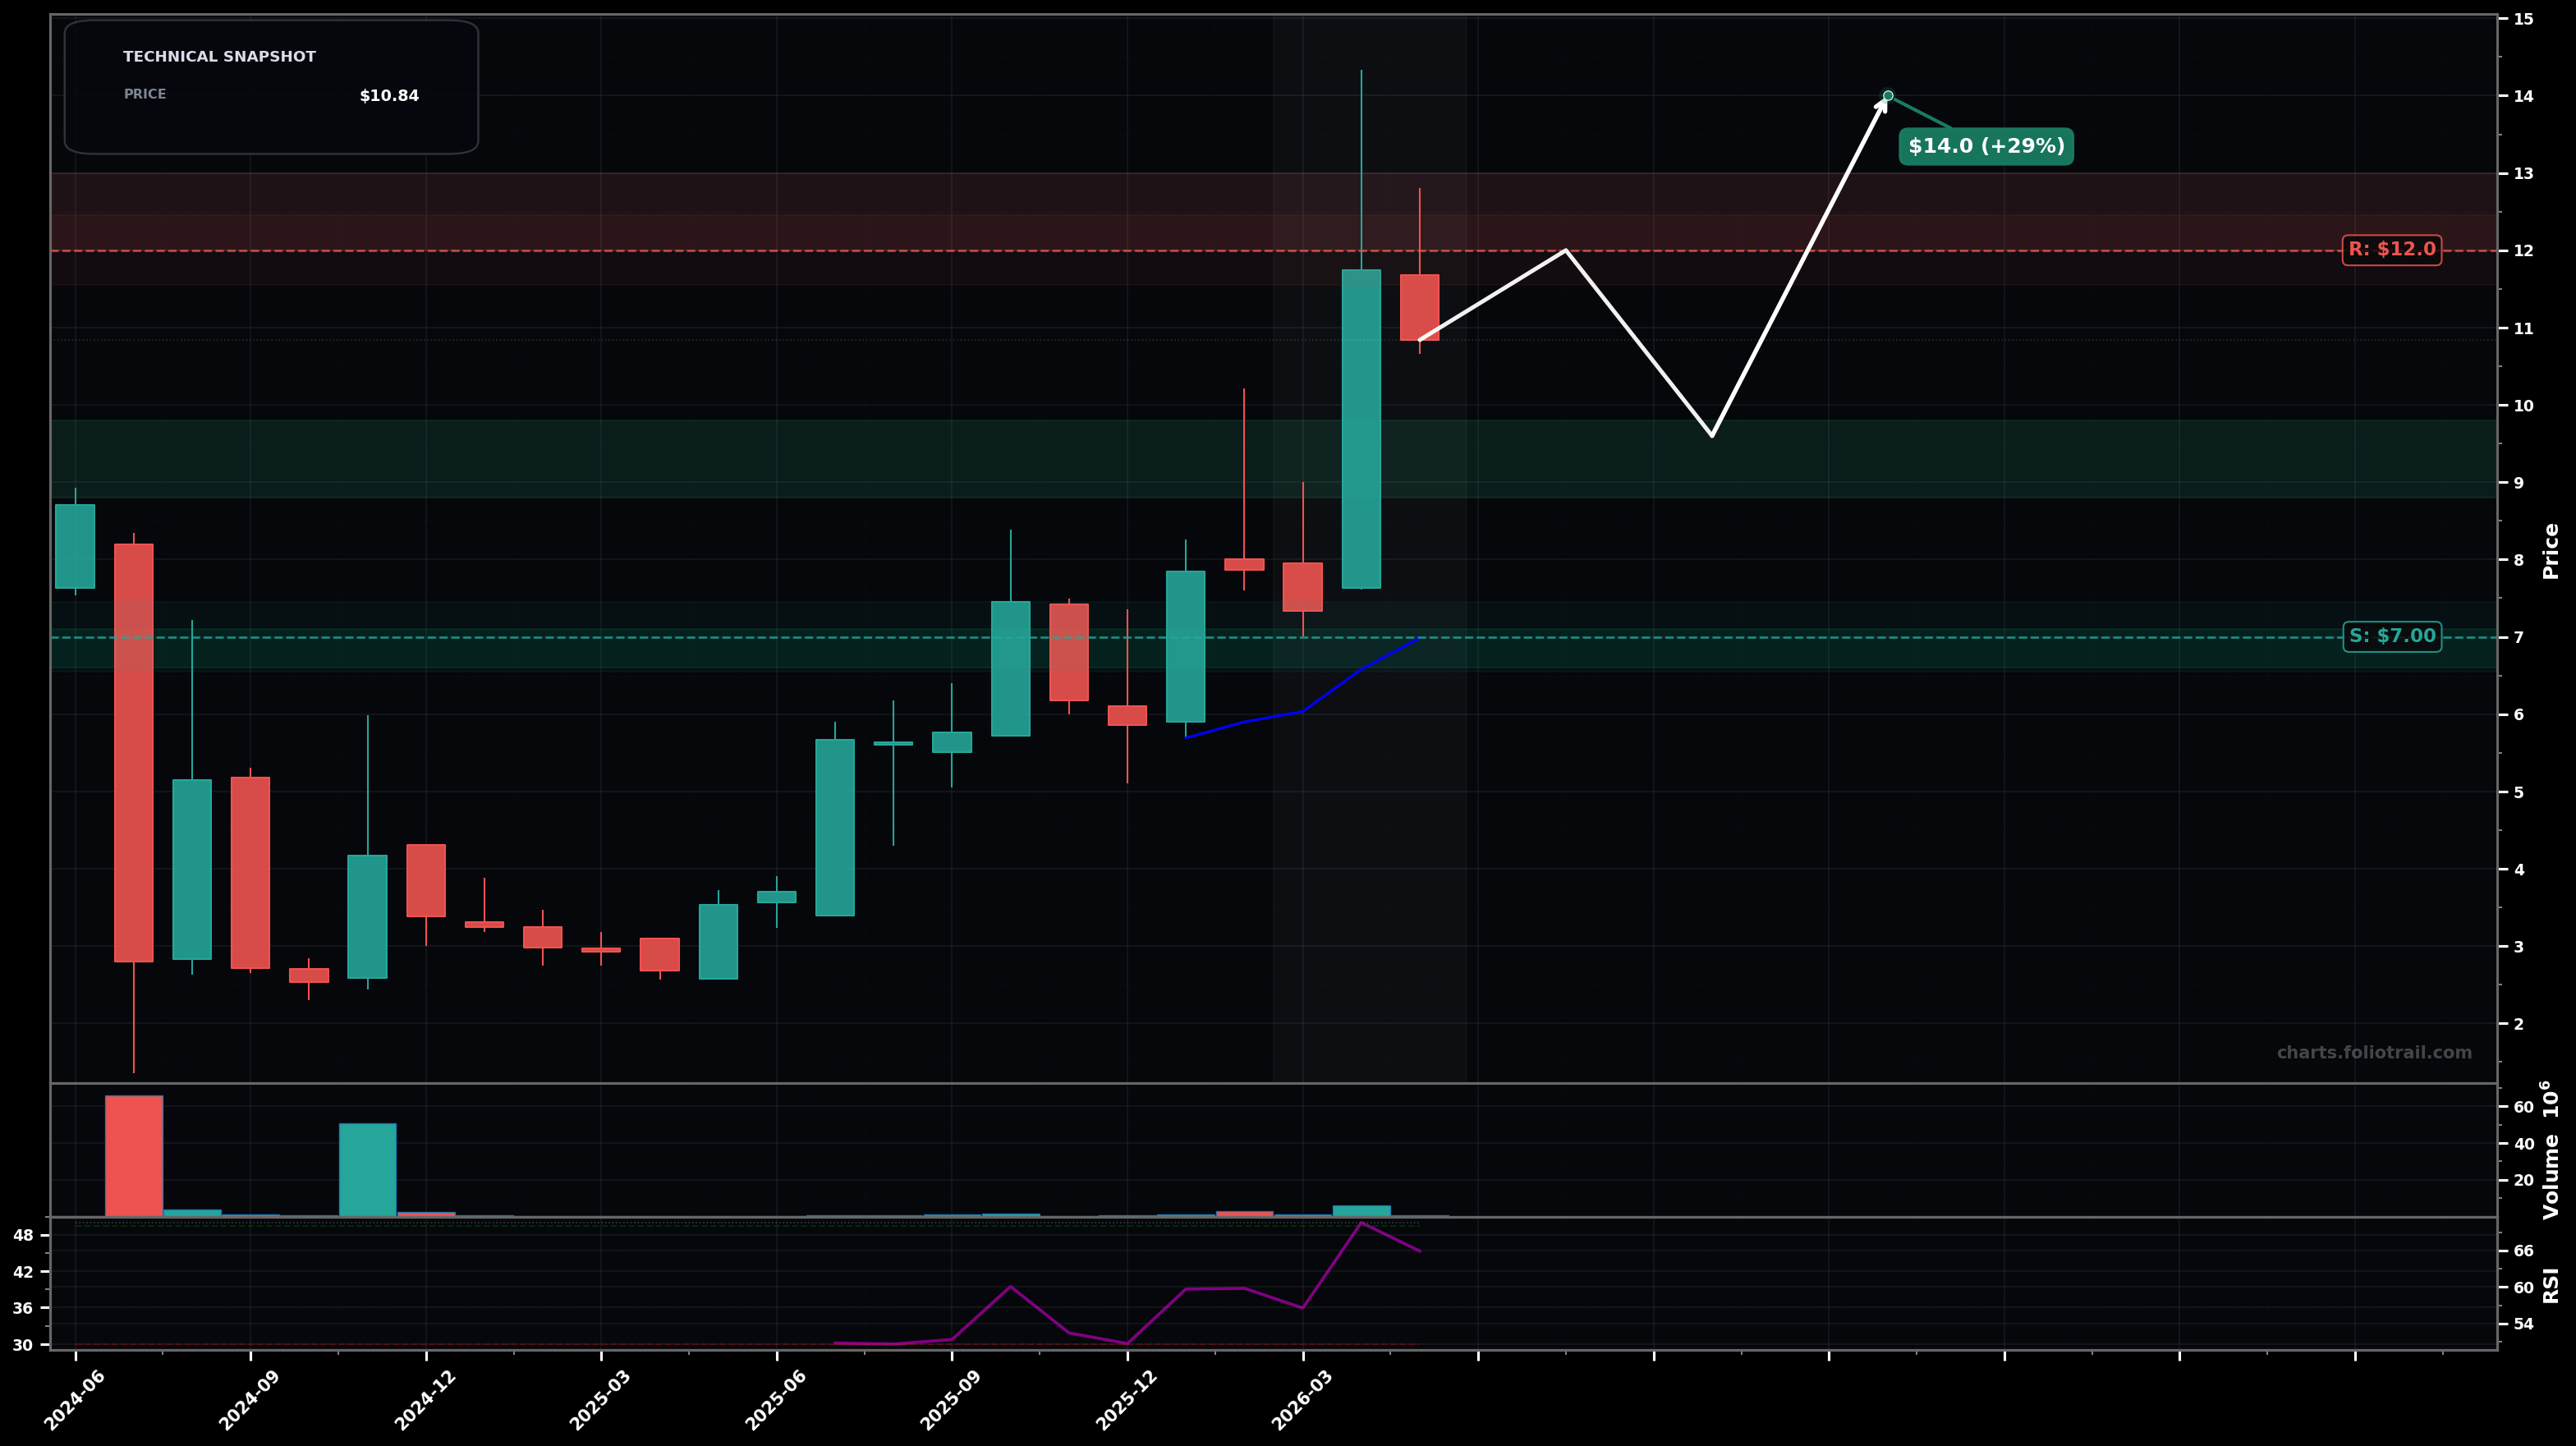
As of May 08, 2026, TOYO (Toyo Co., Ltd.) is in a volatility expansion state on the monthly chart, with a confidence level of 72%. Key support is at $7.00 and key resistance at $12.0. Monthly impulsive breakout to new swing highs followed by a 1-candle pullback; price still well above rising EMA20 (~$6.98), RSI-14 ~66 cooling from a spike.
Bullish continuation after a controlled pullback: price retests the breakout zone (~$9.00–$9.80), holds as a higher low, then makes another push to retest/clear the ~$12 supply.
Deeper mean-reversion: the breakout fails short-term and price retraces toward the impulse origin/EMA20 region; base-building between ~$6.90–$8.00 before any renewed uptrend attempt.
2 monthly closes above $11.80
Monthly close below $6.90 (loss of EMA20 area/impulse support)
Buy-the-dip plan around breakout retest (~$9–$10), then prior consolidation (~$7.6–$8.4), with heavy adds at EMA20/impulse support (~$6.6–$7.1) where a HL should form if trend is intact.
Trim into prior spike highs/round-number supply ($12–$13), trim more if extension continues ($14–$15), and consider full exit if a blow-off extension appears ($16.5+) given volatility-expansion risk.
As of May 08, 2026, TOYO (Toyo Co., Ltd.) is in a volatility expansion state on the monthly chart with 72% confidence. Monthly impulsive breakout to new swing highs followed by a 1-candle pullback; price still well above rising EMA20 (~$6.98), RSI-14 ~66 cooling from a spike.
On the monthly timeframe, TOYO has key support at $7.00 and key resistance at $12.0. The most likely scenario (bullish) targets $12.0 and $14.0, with a revert level at $9.60.
TOYO (Toyo Co., Ltd.) is currently classified as volatility expansion on the monthly chart, with 72% confidence. Confirmation requires: 2 monthly closes above $11.80 This would be invalidated by: Monthly close below $6.90 (loss of EMA20 area/impulse support)
The most likely scenario (bullish) targets $12.0 and $14.0, with a revert level at $9.60. The alternative scenario (bearish) targets $8.00 and $6.90.
Multi-layer AI agents analyse 200+ stocks across daily, weekly, and monthly timeframes — producing market state classifications, price scenarios with targets, and position entry/exit levels. Daily charts updated every trading day at 6 PM ET. Weekly charts refresh Fridays. Monthly charts refresh on the last trading day of each month. No paywall. No sign-up required.
Built by Foliotrail.
All content on this website — including charts, analysis, price targets, support/resistance levels, and position zones — is generated entirely by AI and provided for educational and informational purposes only.
This is not financial advice. NEXUSNOIR VENTURES SL (the operator of this website) is not a registered investment adviser or broker-dealer. You should not make investment decisions based solely on this information. Always do your own research and consult a qualified financial advisor.
By continuing, you acknowledge that you have read and agree to our full disclaimer & terms of use and privacy policy.