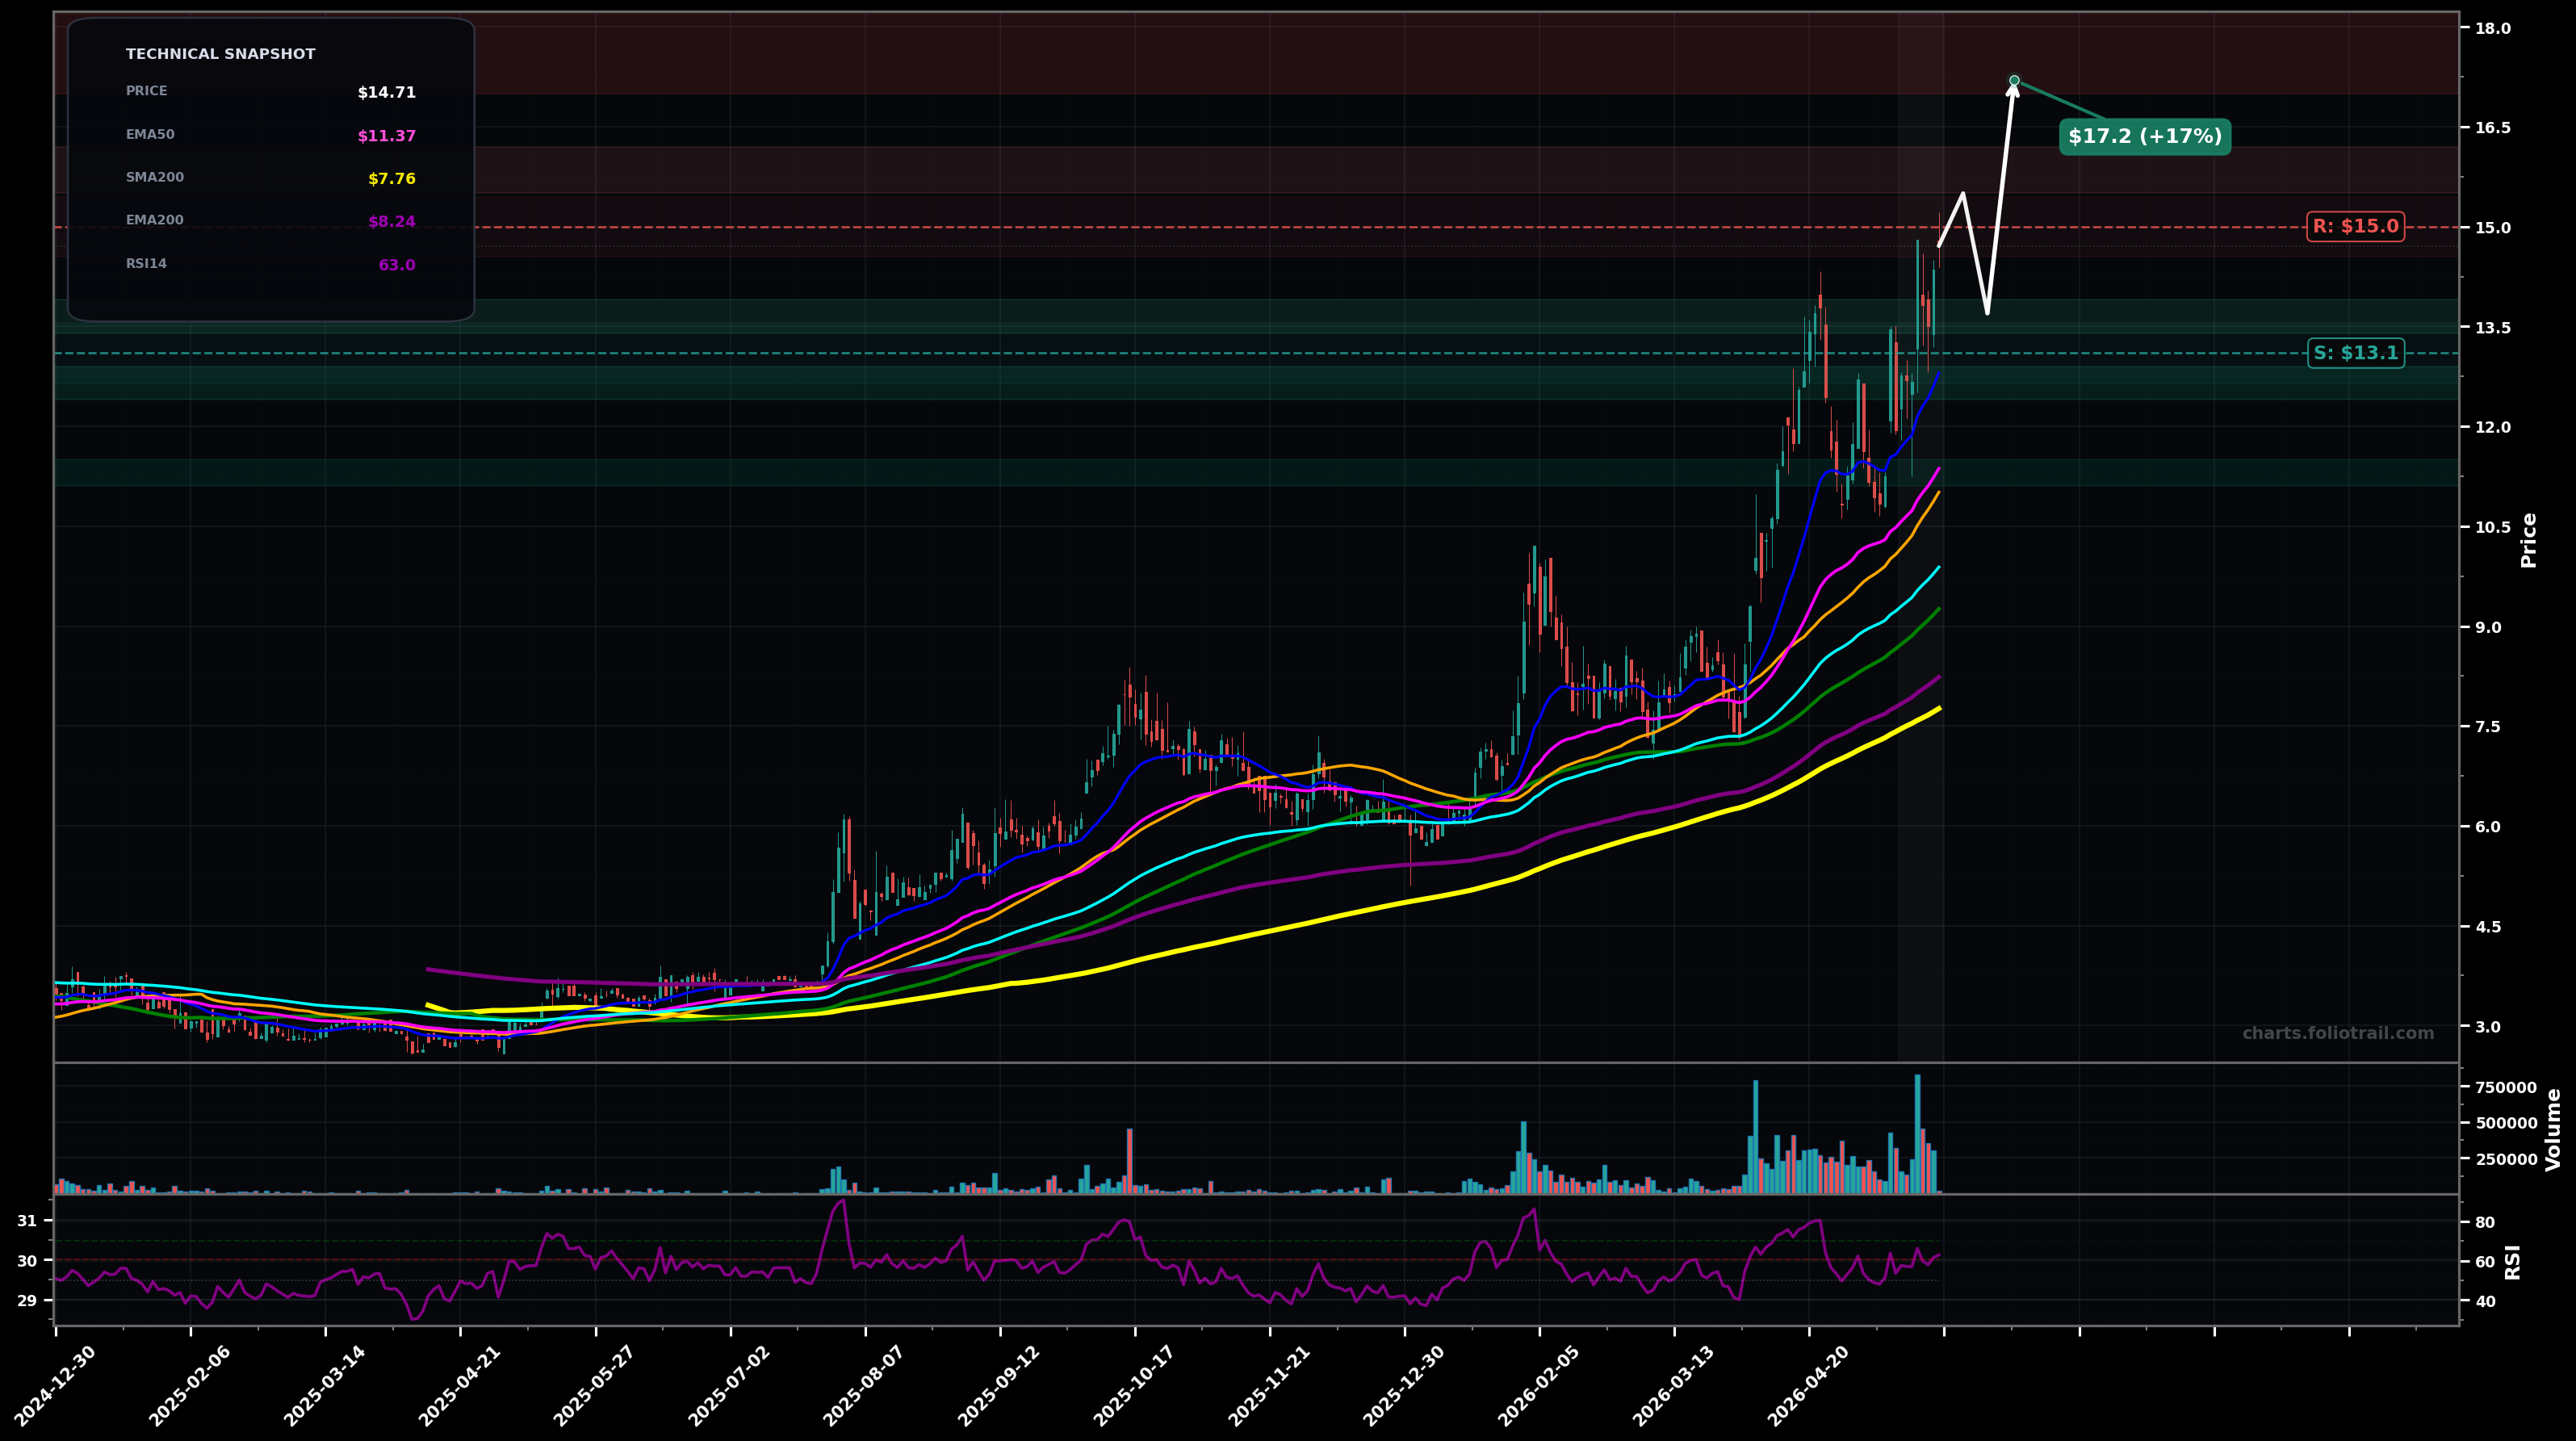
As of May 22, 2026, TOYO (Toyo Co., Ltd.) is in a uptrend state on the daily chart, with a confidence level of 74%. Key support is at $13.1 and key resistance at $15.0. Price is at $14.71 making fresh HHs after a sharp impulse leg; holding well above all key EMAs/SMAs with RSI ~$62.96 (strong but not extreme).
Bullish continuation: brief consolidation/pullback toward prior breakout area, then push to new highs (Elliott: late wave 5 extension or wave 3 of a higher degree; Fib: continuation toward 1.272–1.618 extension of the last pullback).
Bearish corrective swing: momentum fades near $15, price mean-reverts toward EMA50/SMA50 area (Elliott: wave 4 / ABC correction), then attempts a base for the next leg.
Daily close above $15.00 with follow-through (no immediate rejection) would confirm trend continuation.
Daily close below $12.80 (≈EMA200 $8.24 is far; $12.80 is the nearer swing/EMA20 zone break) would weaken the uptrend and signal a deeper correction.
Buy-the-dip zones mapped to prior breakout/swing support ($13s) then EMA50/SMA50 confluence ($12s) and deeper mean-reversion to the next demand shelf near $11s if a larger ABC unfolds.
Trim into strength at likely extension/rejection areas: first above round-number $15 and recent range expansion, then Fib-extension zone $17–$18, and fully exit only if price becomes multi-year stretched vs rising long MAs (SMA200 $7.76/EMA200 $8.24).
As of May 22, 2026, TOYO (Toyo Co., Ltd.) is in a uptrend state on the daily chart with 74% confidence. Price is at $14.71 making fresh HHs after a sharp impulse leg; holding well above all key EMAs/SMAs with RSI ~$62.96 (strong but not extreme).
On the daily timeframe, TOYO has key support at $13.1 and key resistance at $15.0. The most likely scenario (bullish) targets $15.5 and $17.2, with a revert level at $13.7.
TOYO (Toyo Co., Ltd.) is currently classified as uptrend on the daily chart, with 74% confidence. Confirmation requires: Daily close above $15.00 with follow-through (no immediate rejection) would confirm trend continuation. This would be invalidated by: Daily close below $12.80 (≈EMA200 $8.24 is far; $12.80 is the nearer swing/EMA20 zone break) would weaken the uptrend and signal a deeper correction.
The most likely scenario (bullish) targets $15.5 and $17.2, with a revert level at $13.7. The alternative scenario (bearish) targets $12.8 and $11.4.
Multi-layer AI agents analyse 200+ stocks across daily, weekly, and monthly timeframes — producing market state classifications, price scenarios with targets, and position entry/exit levels. Daily charts updated every trading day at 6 PM ET. Weekly charts refresh Fridays. Monthly charts refresh on the last trading day of each month. No paywall. No sign-up required.
Built by Foliotrail.
All content on this website — including charts, analysis, price targets, support/resistance levels, and position zones — is generated entirely by AI and provided for educational and informational purposes only.
This is not financial advice. NEXUSNOIR VENTURES SL (the operator of this website) is not a registered investment adviser or broker-dealer. You should not make investment decisions based solely on this information. Always do your own research and consult a qualified financial advisor.
By continuing, you acknowledge that you have read and agree to our full disclaimer & terms of use and privacy policy.