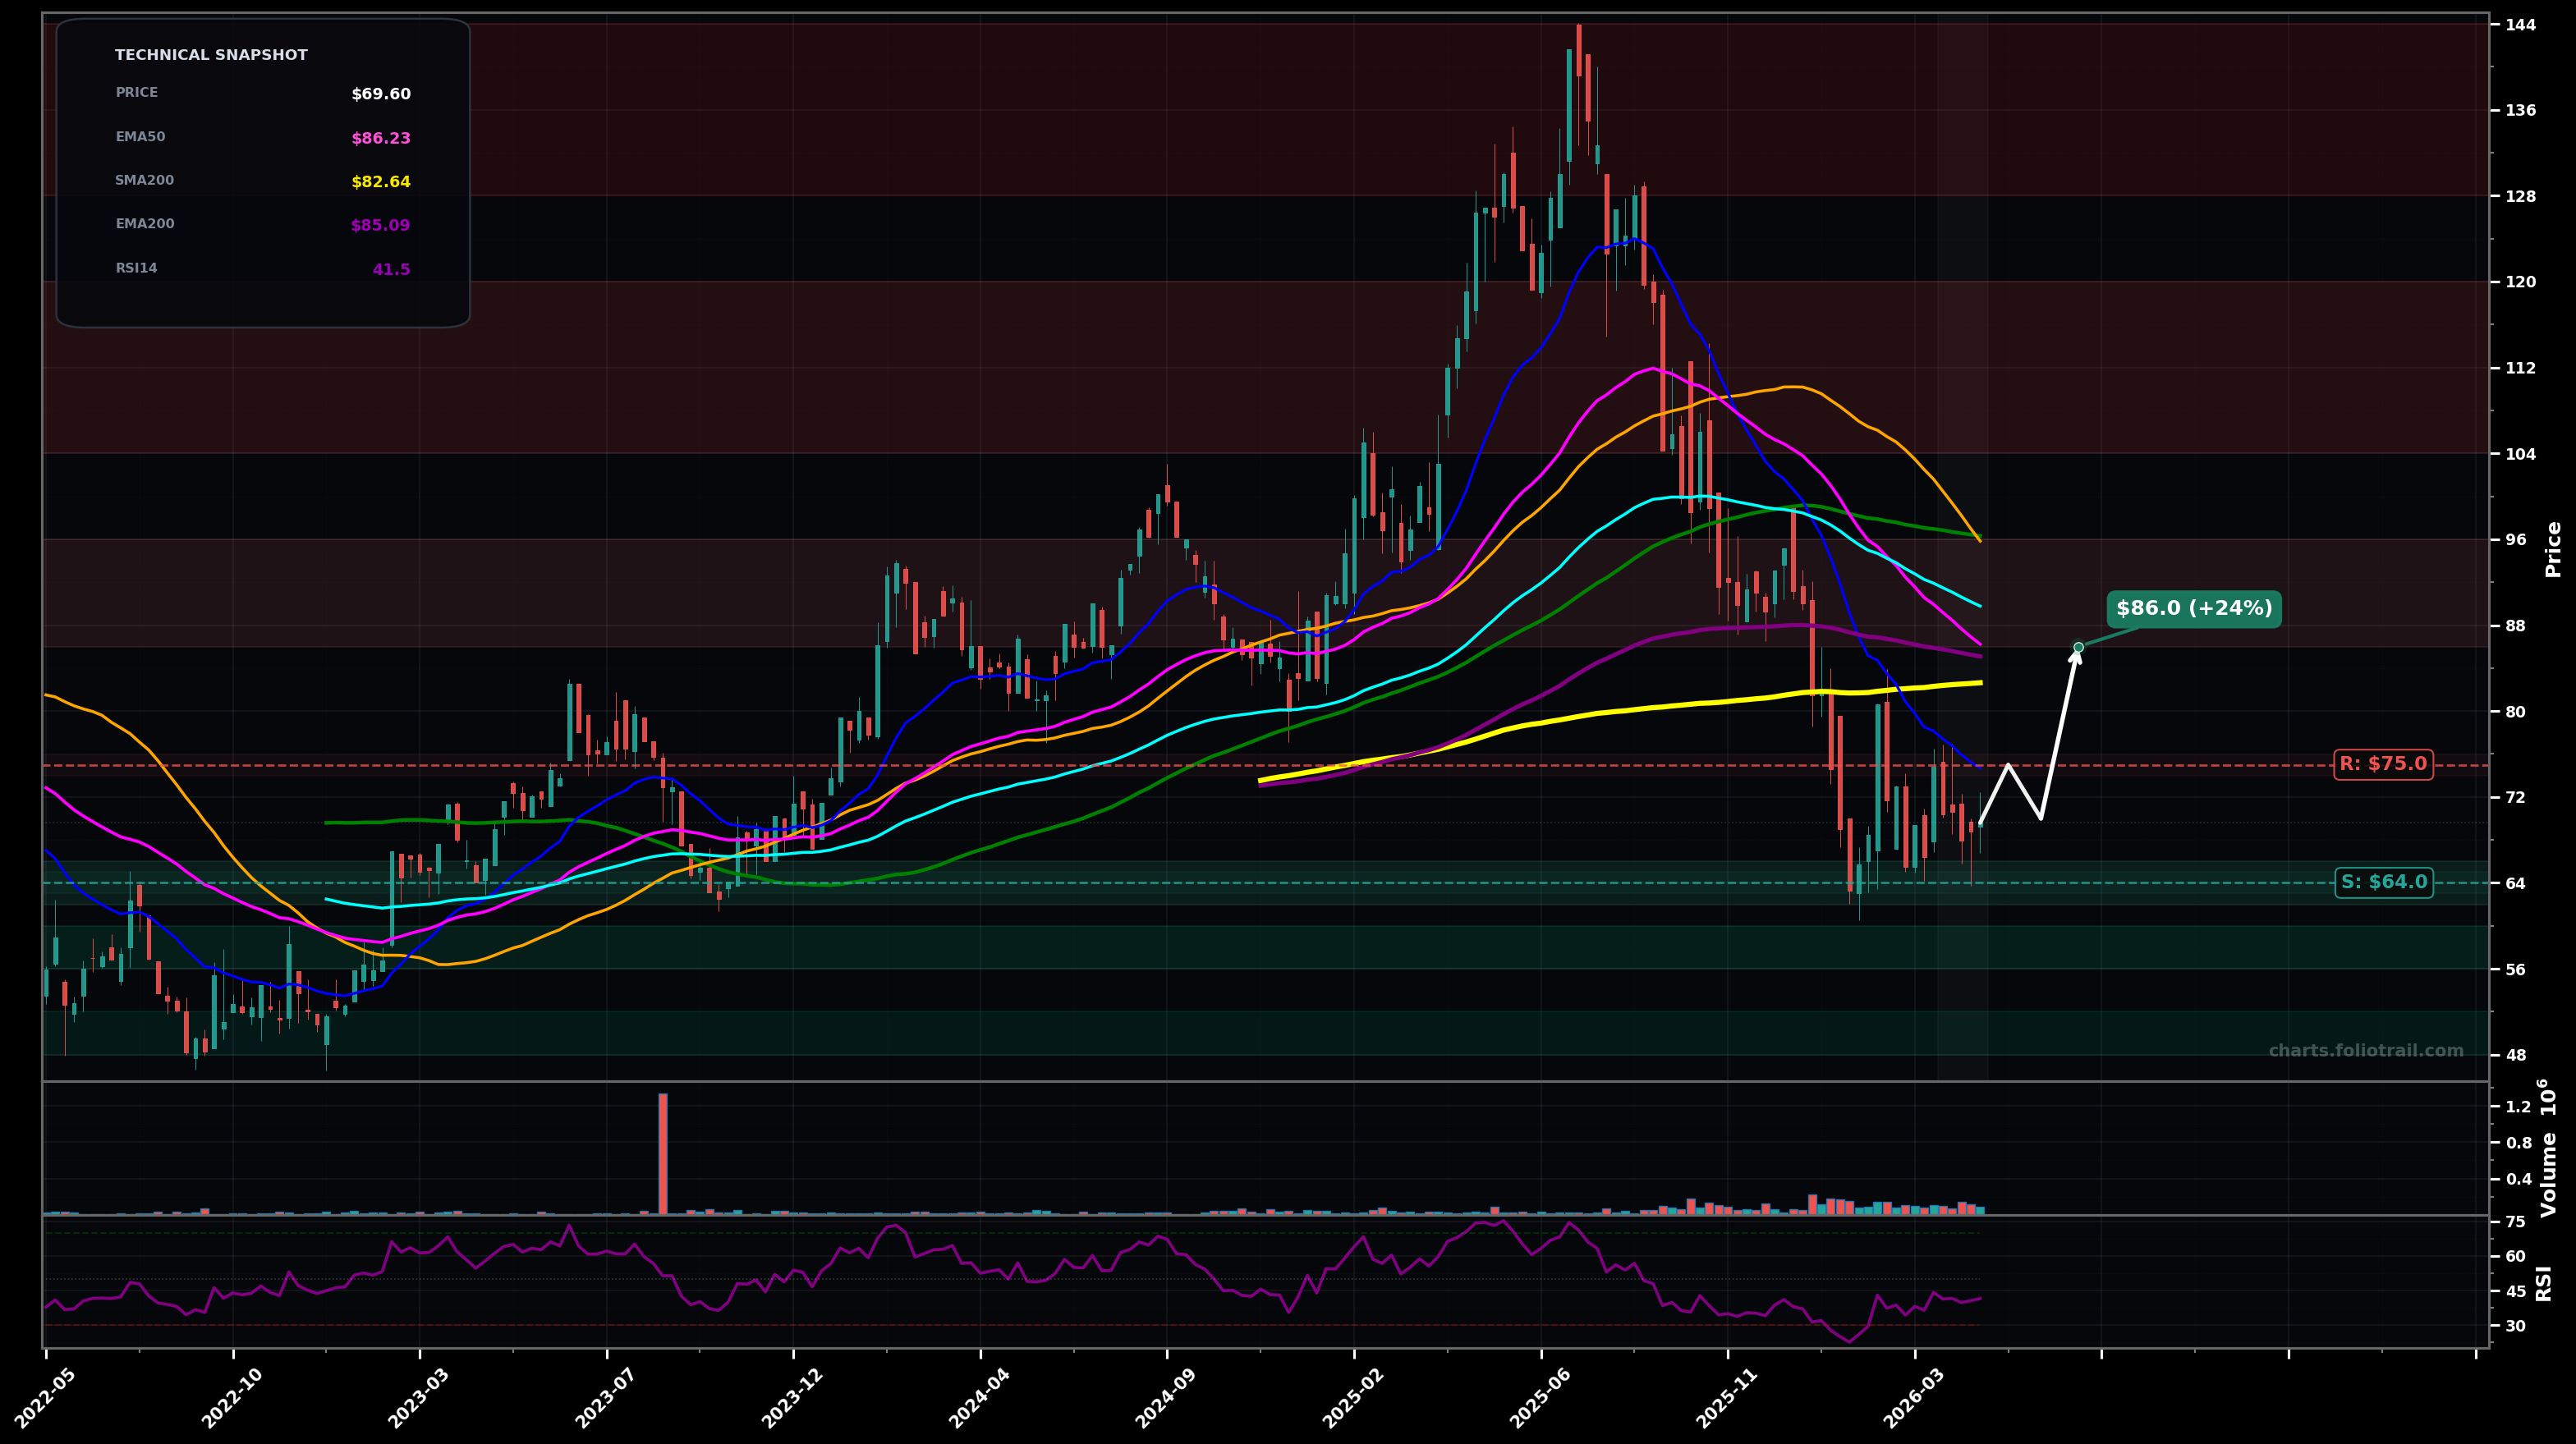
As of May 22, 2026, TOITF (Topicus.com Inc.) is in a downtrend state on the weekly chart, with a confidence level of 74%. Key support is at $64.0 and key resistance at $75.0. Weekly downtrend continuation with a weak sideways bounce; price ~$69.60 sits below EMA50/100/200 and below SMA50/100/200 after a sharp selloff from the ~$140 peak; RSI ~41 shows mild bearish momentum but not deeply oversold.
Base-building attempt between ~$64-$75, then a relief rally to retest declining MAs (typical wave-4/B type bounce) before sellers reappear near the EMA200/EMA50 cluster.
Support fails and price resumes the impulse down (wave-5/C continuation), targeting the next demand zone near the prior consolidation/round-number support.
Weekly close below $64 would confirm continued downside (fresh LL).
Weekly close above $86 (EMA50) would invalidate the active downtrend and shift to a reversal/base-break scenario.
Start near the current swing-low support (~$64) with tight risk; add on a deeper flush into next demand (~$56-60); heavy add only if capitulation pushes toward the prior multi-month base/psych support (~$50) while watching for a weekly reversal candle.
Trim into the first major MA/supply band (EMA50/100 + prior breakdown area ~$86-96); trim more into the next resistance shelf (~$104-120); fully close into the prior blow-off/top zone (~$128-144) where rejection risk historically spikes.
As of May 22, 2026, TOITF (Topicus.com Inc.) is in a downtrend state on the weekly chart with 74% confidence. Weekly downtrend continuation with a weak sideways bounce; price ~$69.60 sits below EMA50/100/200 and below SMA50/100/200 after a sharp selloff from the ~$140 peak; RSI ~41 shows mild bearish momentum but not deeply oversold.
On the weekly timeframe, TOITF has key support at $64.0 and key resistance at $75.0. The most likely scenario (bullish) targets $75.0 and $86.0, with a revert level at $70.0.
TOITF (Topicus.com Inc.) is currently classified as downtrend on the weekly chart, with 74% confidence. Confirmation requires: Weekly close below $64 would confirm continued downside (fresh LL). This would be invalidated by: Weekly close above $86 (EMA50) would invalidate the active downtrend and shift to a reversal/base-break scenario.
The most likely scenario (bullish) targets $75.0 and $86.0, with a revert level at $70.0. The alternative scenario (bearish) targets $64.0 and $56.0.
Multi-layer AI agents analyse 200+ stocks across daily, weekly, and monthly timeframes — producing market state classifications, price scenarios with targets, and position entry/exit levels. Daily charts updated every trading day at 6 PM ET. Weekly charts refresh Fridays. Monthly charts refresh on the last trading day of each month. No paywall. No sign-up required.
Built by Foliotrail.
All content on this website — including charts, analysis, price targets, support/resistance levels, and position zones — is generated entirely by AI and provided for educational and informational purposes only.
This is not financial advice. NEXUSNOIR VENTURES SL (the operator of this website) is not a registered investment adviser or broker-dealer. You should not make investment decisions based solely on this information. Always do your own research and consult a qualified financial advisor.
By continuing, you acknowledge that you have read and agree to our full disclaimer & terms of use and privacy policy.