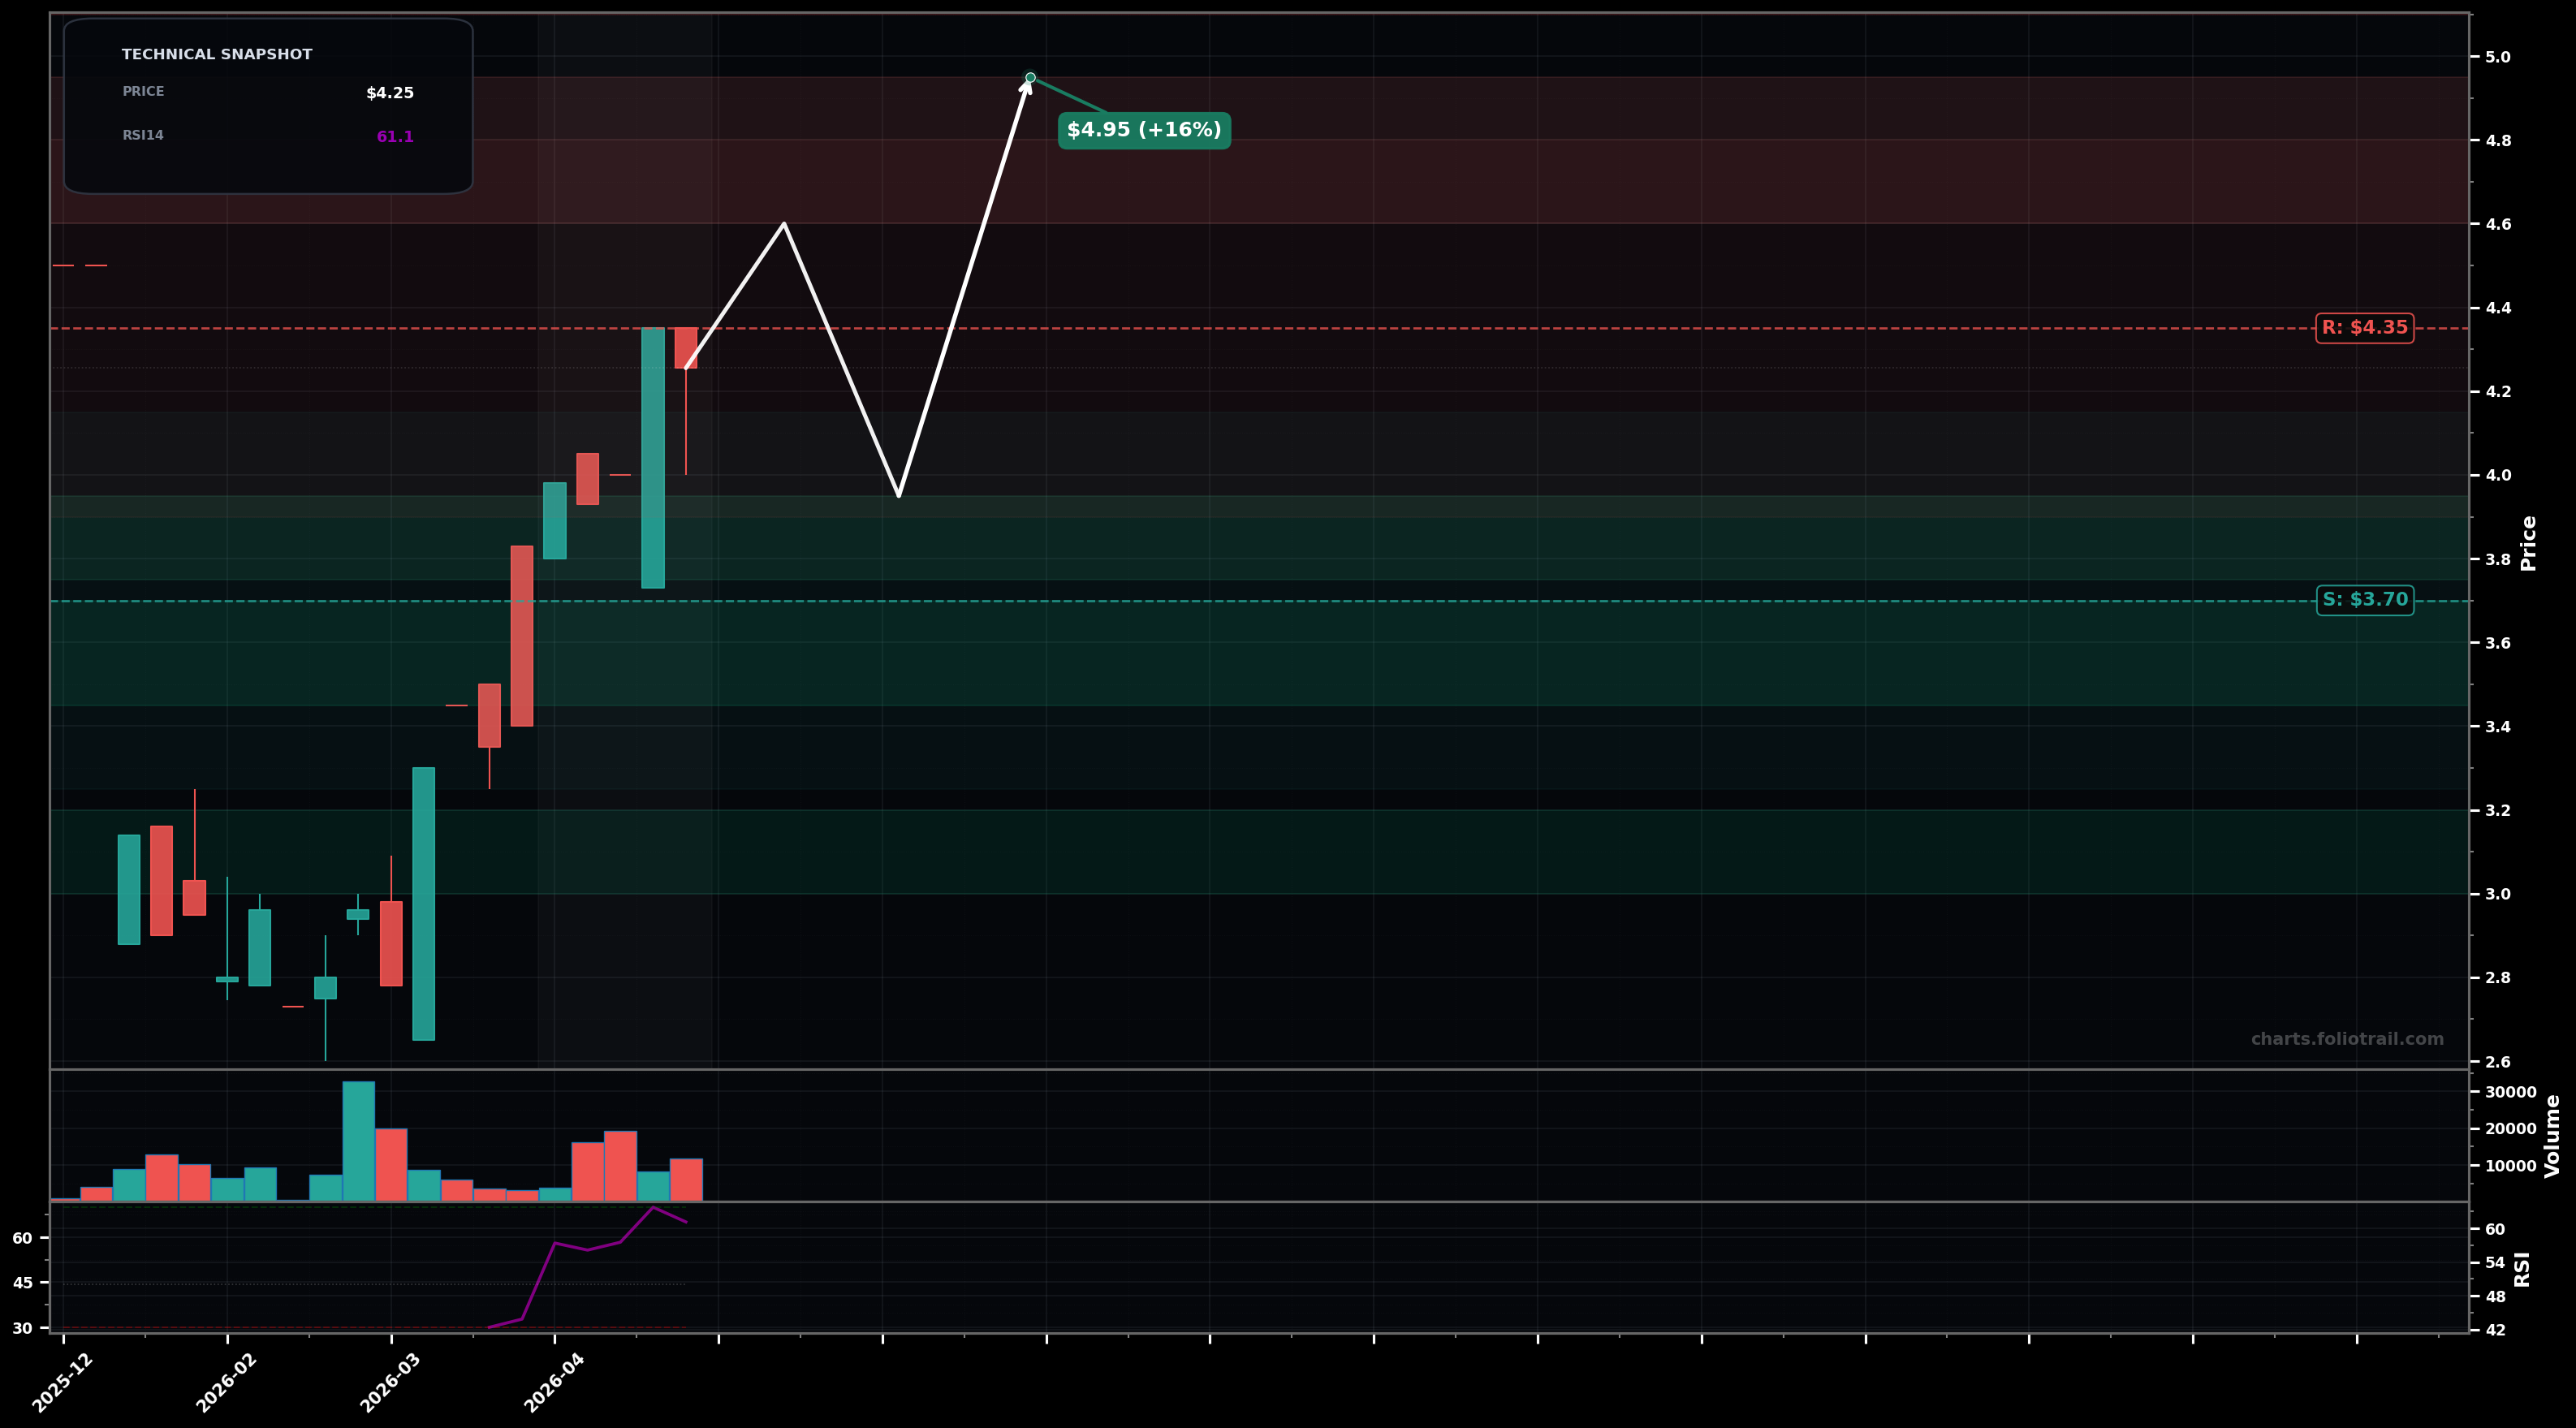
As of May 22, 2026, TMLDF (Tasmea Limited) is in a uptrend state on the weekly chart, with a confidence level of 63%. Key support is at $3.70 and key resistance at $4.35. Weekly up-leg into ~$4.35 followed by small red pullback; price still well above short-term trend (EMA20 ~$3.73) with RSI ~61 (bullish but not extreme).
Bullish continuation: a shallow pullback/consolidation above $3.70–$3.90, then a push through $4.35 to new highs (likely Wave 5 extension after a Wave 4 pause). Rough probability: 60%.
Deeper corrective retrace: rejection near $4.35 leads to a drop toward the prior breakout area/EMA20, forming a larger Wave 4 before the next attempt higher. Rough probability: 40%.
Weekly close above $4.35 (break/hold over the recent swing high).
Weekly close below $3.70 (loss of EMA20 zone and last consolidation floor).
Entries laddered around EMA20/support ($3.70–$3.95), then prior breakout base ($3.45–$3.70), with heavy add near the earlier range top/major pivot zone (~$3.00–$3.20) if a deeper Wave-4 retrace occurs.
Trim into upside extensions above the prior swing high ($4.35) where Fib-style run-ups typically stall ($4.6–$5.6), and fully exit only on a multi-year-style overshoot/mania extension ($6.2+).
As of May 22, 2026, TMLDF (Tasmea Limited) is in a uptrend state on the weekly chart with 63% confidence. Weekly up-leg into ~$4.35 followed by small red pullback; price still well above short-term trend (EMA20 ~$3.73) with RSI ~61 (bullish but not extreme).
On the weekly timeframe, TMLDF has key support at $3.70 and key resistance at $4.35. The most likely scenario (bullish) targets $4.60 and $4.95, with a revert level at $3.95.
TMLDF (Tasmea Limited) is currently classified as uptrend on the weekly chart, with 63% confidence. Confirmation requires: Weekly close above $4.35 (break/hold over the recent swing high). This would be invalidated by: Weekly close below $3.70 (loss of EMA20 zone and last consolidation floor).
The most likely scenario (bullish) targets $4.60 and $4.95, with a revert level at $3.95. The alternative scenario (bearish) targets $3.55 and $3.05.
Multi-layer AI agents analyse 200+ stocks across daily, weekly, and monthly timeframes — producing market state classifications, price scenarios with targets, and position entry/exit levels. Daily charts updated every trading day at 6 PM ET. Weekly charts refresh Fridays. Monthly charts refresh on the last trading day of each month. No paywall. No sign-up required.
Built by Foliotrail.
All content on this website — including charts, analysis, price targets, support/resistance levels, and position zones — is generated entirely by AI and provided for educational and informational purposes only.
This is not financial advice. NEXUSNOIR VENTURES SL (the operator of this website) is not a registered investment adviser or broker-dealer. You should not make investment decisions based solely on this information. Always do your own research and consult a qualified financial advisor.
By continuing, you acknowledge that you have read and agree to our full disclaimer & terms of use and privacy policy.