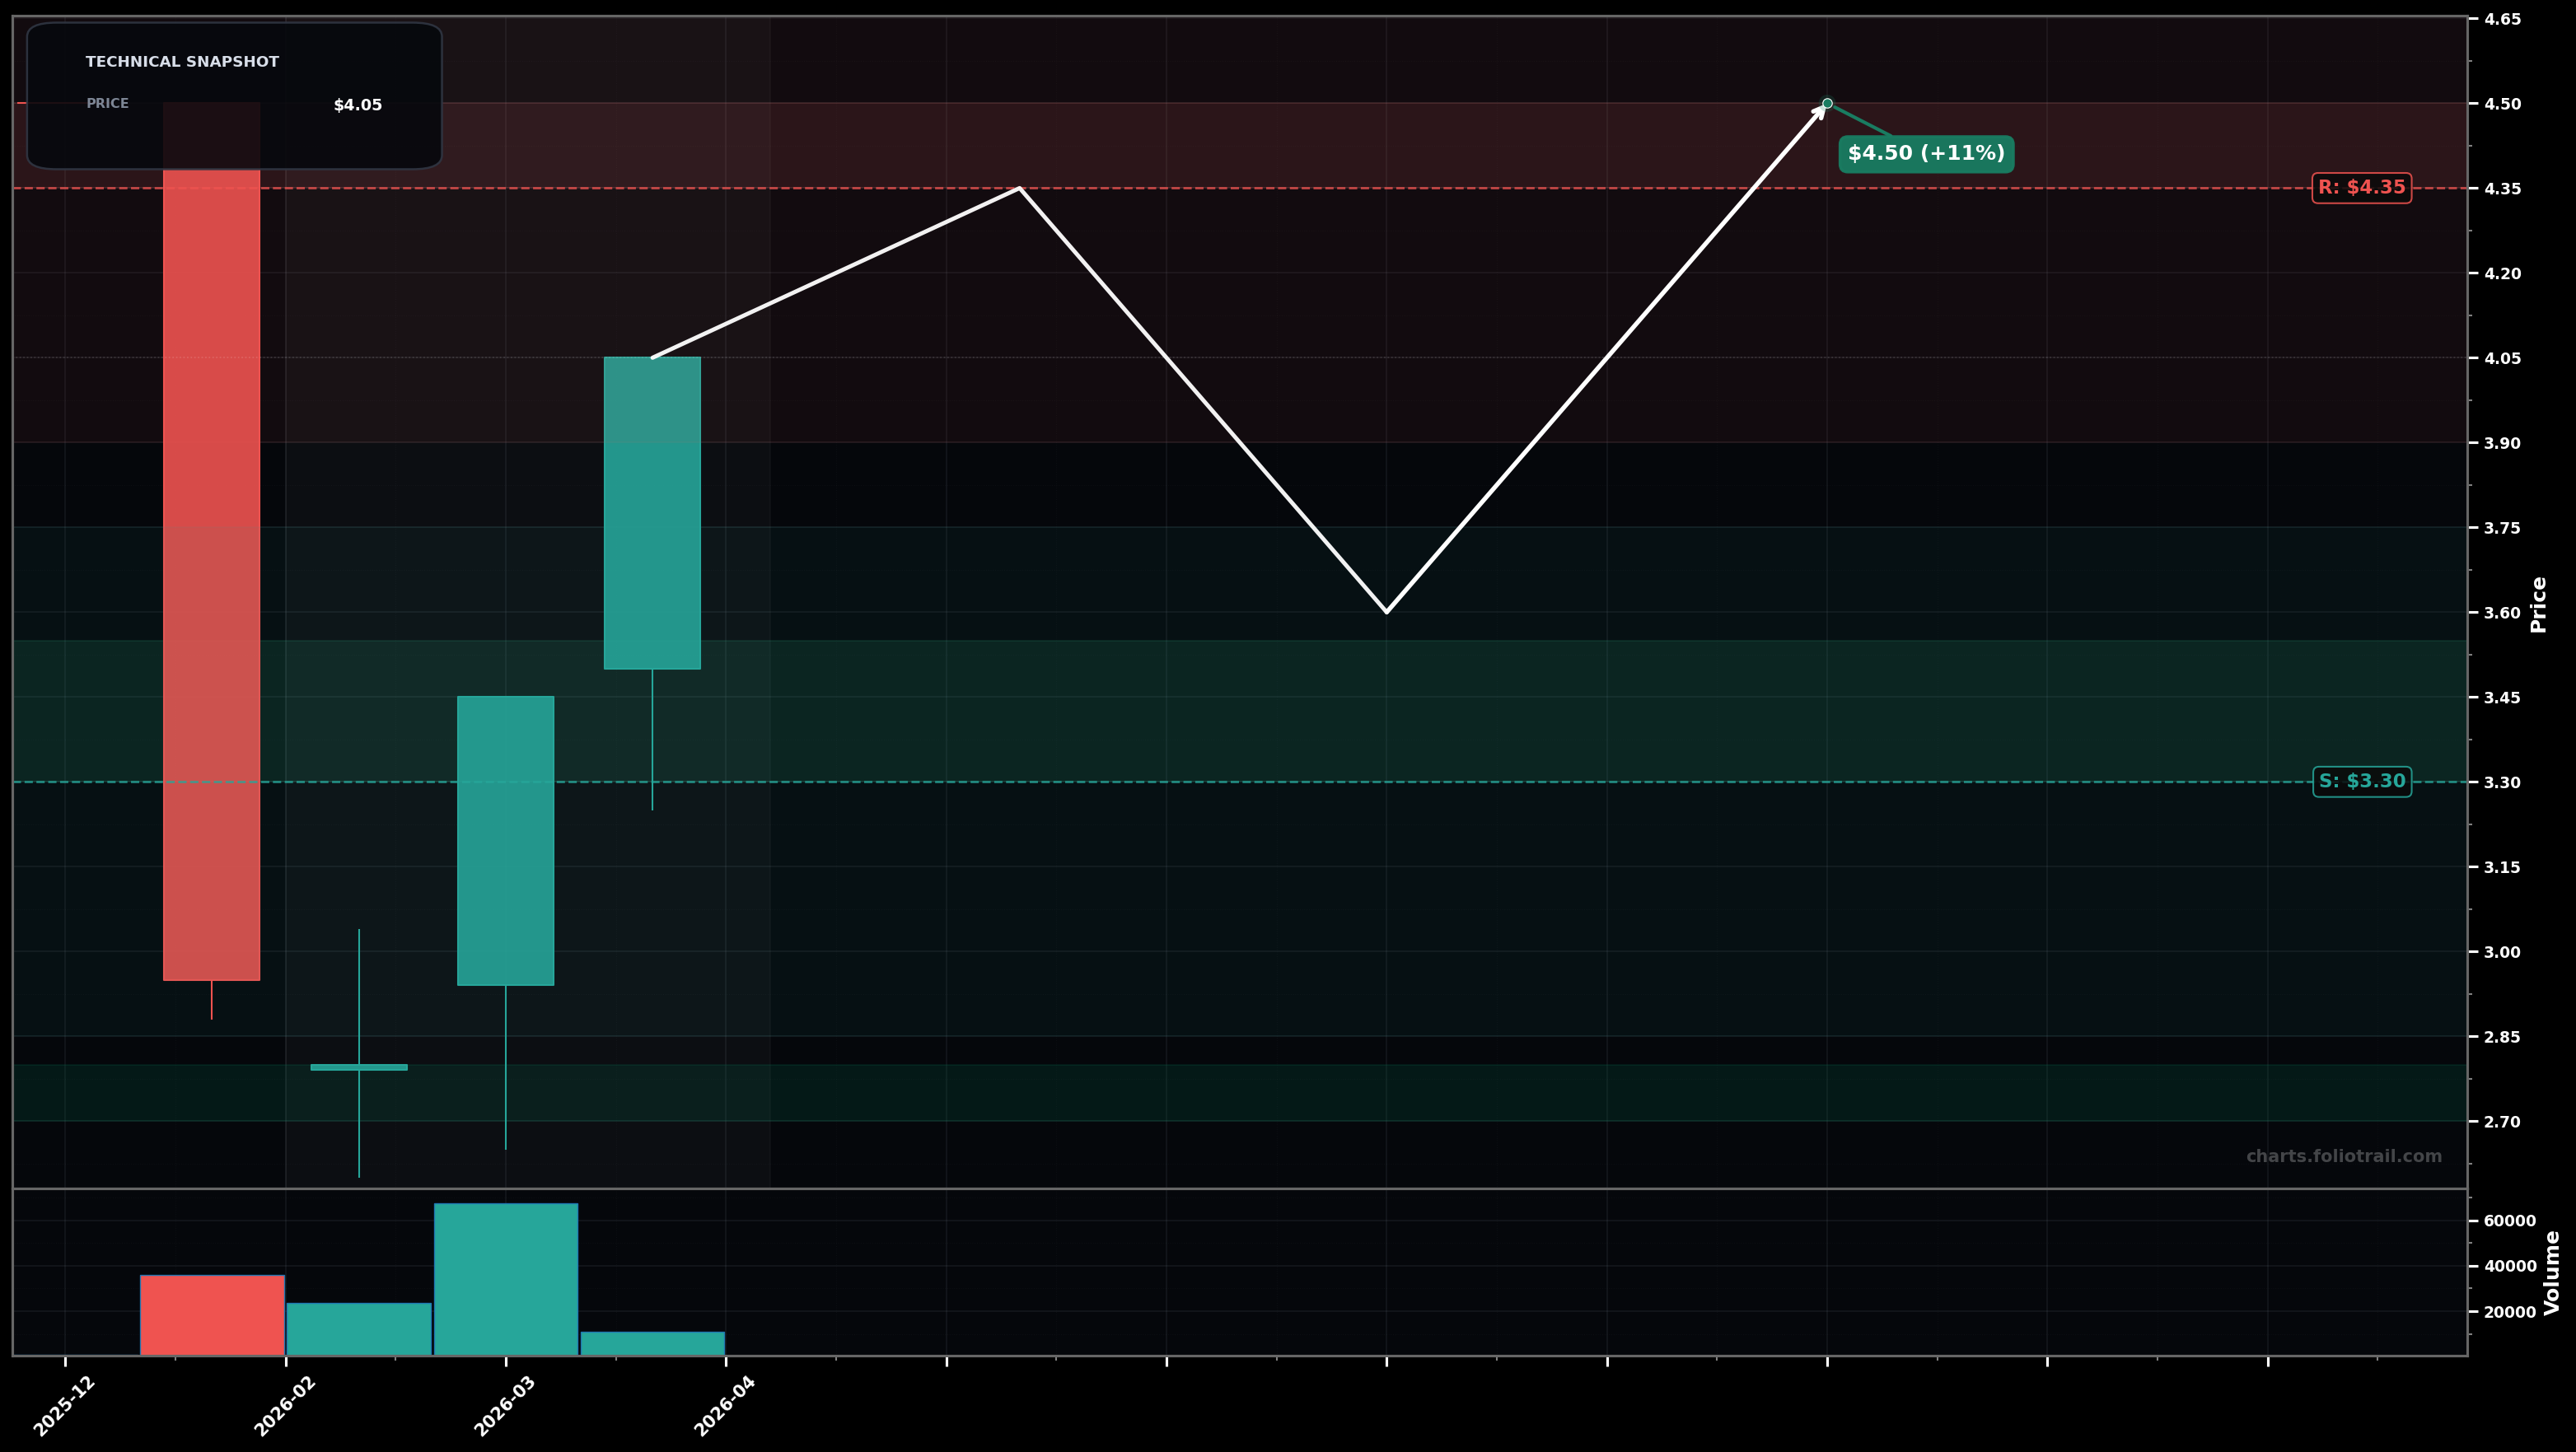
As of April 30, 2026, TMLDF (Tasmea Limited) is in a bottoming attempt state on the monthly chart, with a confidence level of 58%. Key support is at $3.30 and key resistance at $4.35. After a sharp monthly selloff, price bounced with 2 strong green months; latest month closed around $4.05 near the upper end of its range, still below the prior breakdown area.
Base-build then grind higher: price retests $3.60-$3.45 (former pivot zone) and then pushes into the $4.35 supply; a clean break can extend the rally toward the prior selloff open/supply.
Rejection at resistance: rally fails under $4.35 and price rolls over into a deeper retest of the rebound base; if support breaks, the market revisits the capitulation low zone.
Monthly close above $4.35 (and ideally hold above it for 2 monthly closes).
Monthly close below $2.70.
Buy zones are aligned to the rebound pivot/support ($3.3 area) and the swing-low/undercut level ($2.7); add more only if price tests support without a monthly close breakdown.
Trim into the first major supply/failed-breakdown area ($4.35-$4.50), then heavier trims into extension levels above the rebound range; full exit only if price becomes clearly stretched beyond prior swing structure.
As of April 30, 2026, TMLDF (Tasmea Limited) is in a bottoming attempt state on the monthly chart with 58% confidence. After a sharp monthly selloff, price bounced with 2 strong green months; latest month closed around $4.05 near the upper end of its range, still below the prior breakdown area.
On the monthly timeframe, TMLDF has key support at $3.30 and key resistance at $4.35. The most likely scenario (bullish) targets $4.35 and $4.50, with a revert level at $3.60.
TMLDF (Tasmea Limited) is currently classified as bottoming attempt on the monthly chart, with 58% confidence. Confirmation requires: Monthly close above $4.35 (and ideally hold above it for 2 monthly closes). This would be invalidated by: Monthly close below $2.70.
The most likely scenario (bullish) targets $4.35 and $4.50, with a revert level at $3.60. The alternative scenario (bearish) targets $3.30 and $2.70.
Multi-layer AI agents analyse 200+ stocks across daily, weekly, and monthly timeframes — producing market state classifications, price scenarios with targets, and position entry/exit levels. Daily charts updated every trading day at 6 PM ET. Weekly charts refresh Fridays. Monthly charts refresh on the last trading day of each month. No paywall. No sign-up required.
Built by Foliotrail.
All content on this website — including charts, analysis, price targets, support/resistance levels, and position zones — is generated entirely by AI and provided for educational and informational purposes only.
This is not financial advice. NEXUSNOIR VENTURES SL (the operator of this website) is not a registered investment adviser or broker-dealer. You should not make investment decisions based solely on this information. Always do your own research and consult a qualified financial advisor.
By continuing, you acknowledge that you have read and agree to our full disclaimer & terms of use and privacy policy.