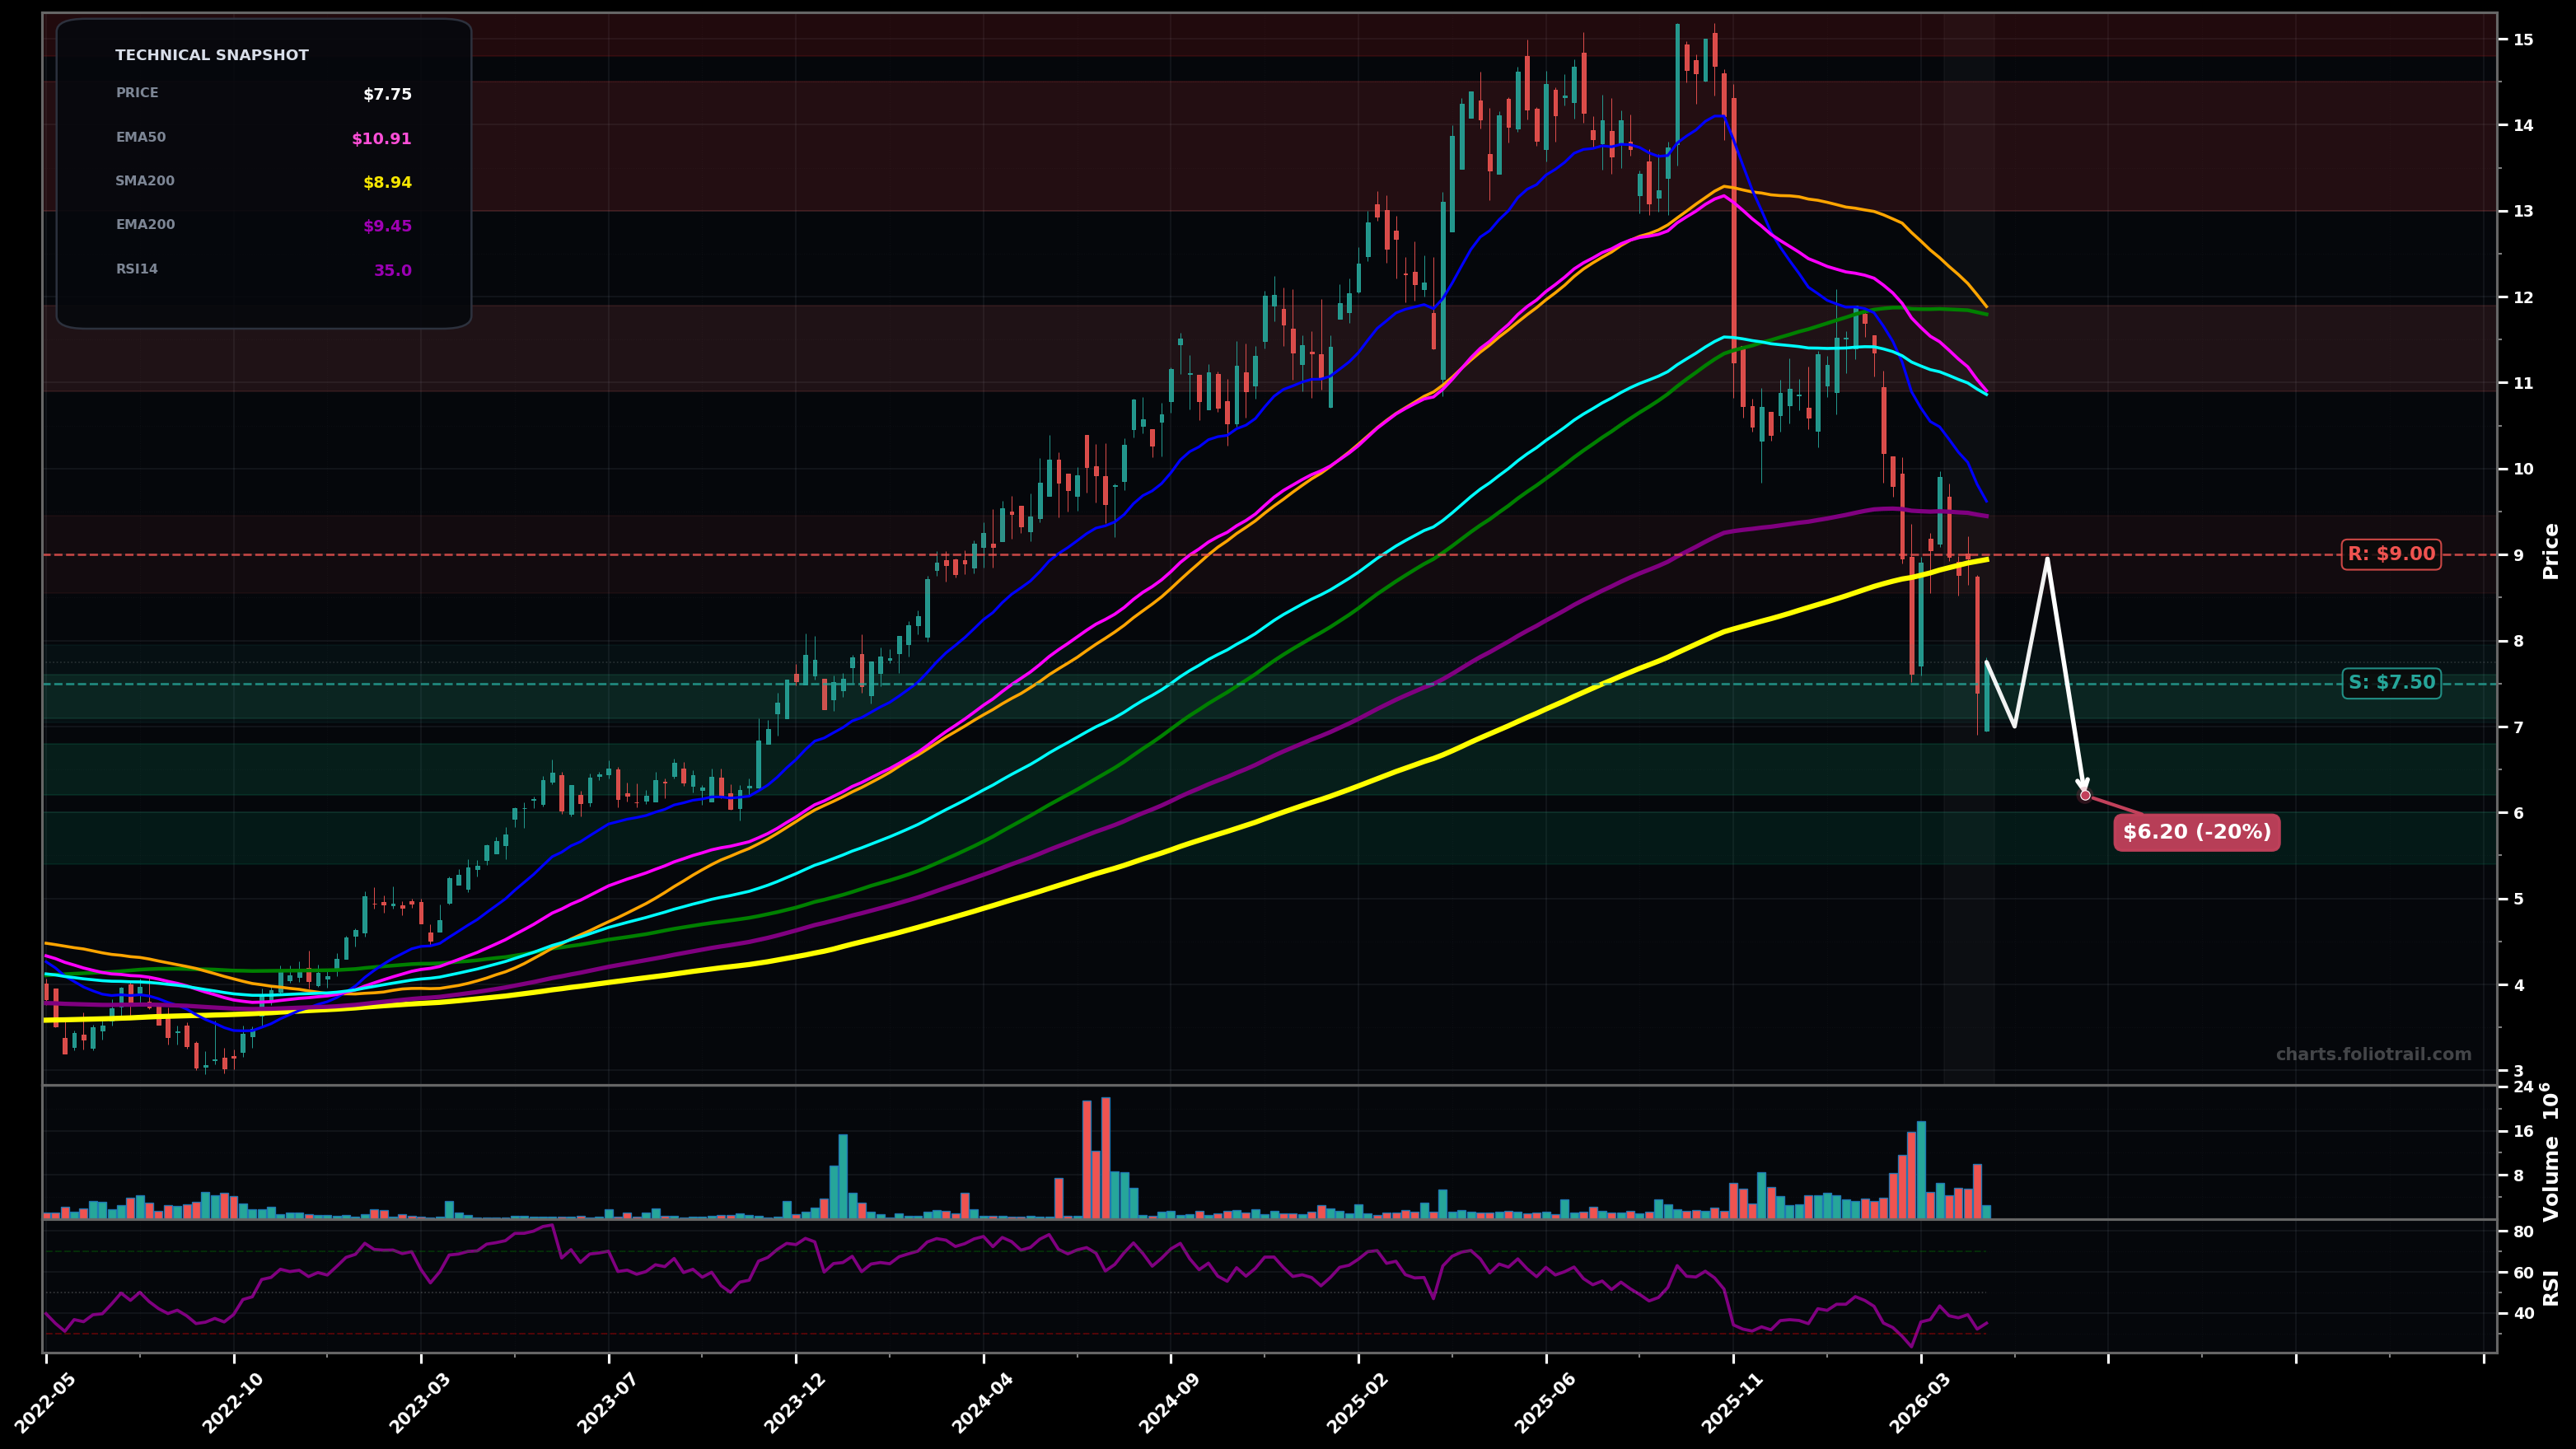
As of May 22, 2026, TGOPY (3i Group plc) is in a falling knife state on the weekly chart, with a confidence level of 74%. Key support is at $7.50 and key resistance at $9.00. Weekly trend flipped from prior HH/HL advance into a sharp selloff; price ($7.75) is below all key MAs with heavy downside momentum and RSI weak (~35).
Bearish continuation: weak bounce fails under ~$9, then price retests/undercuts the recent swing low and drifts toward the next demand zone near the 2023-24 breakout area.
Bottoming attempt: sellers fail to print a decisive new low; price forms a higher low and reclaims the long-term pivot cluster around the EMA200/SMA200, setting up a mean-reversion move toward the broken weekly MAs.
Weekly close below $7.50
Weekly close back above $9.45 (EMA200) and hold (2+ weekly closes)
Scale near current swing-low support (~$7.5) and below into prior breakout/demand; heavy add only if capitulation extends toward deeper fib/structure support (~$5.4-$6.0).
Trim into mean-reversion back to EMA50/SMA50 area (~$11-12), trim more into prior distribution/top range (~$13-14.5), and close into full retest of the ~$15 peak resistance.
As of May 22, 2026, TGOPY (3i Group plc) is in a falling knife state on the weekly chart with 74% confidence. Weekly trend flipped from prior HH/HL advance into a sharp selloff; price ($7.75) is below all key MAs with heavy downside momentum and RSI weak (~35).
On the weekly timeframe, TGOPY has key support at $7.50 and key resistance at $9.00. The most likely scenario (bearish) targets $7.00 and $6.20, with a revert level at $8.95.
TGOPY (3i Group plc) is currently classified as falling knife on the weekly chart, with 74% confidence. Confirmation requires: Weekly close below $7.50 This would be invalidated by: Weekly close back above $9.45 (EMA200) and hold (2+ weekly closes)
The most likely scenario (bearish) targets $7.00 and $6.20, with a revert level at $8.95. The alternative scenario (bullish) targets $9.45 and $10.9.
Multi-layer AI agents analyse 200+ stocks across daily, weekly, and monthly timeframes — producing market state classifications, price scenarios with targets, and position entry/exit levels. Daily charts updated every trading day at 6 PM ET. Weekly charts refresh Fridays. Monthly charts refresh on the last trading day of each month. No paywall. No sign-up required.
Built by Foliotrail.
All content on this website — including charts, analysis, price targets, support/resistance levels, and position zones — is generated entirely by AI and provided for educational and informational purposes only.
This is not financial advice. NEXUSNOIR VENTURES SL (the operator of this website) is not a registered investment adviser or broker-dealer. You should not make investment decisions based solely on this information. Always do your own research and consult a qualified financial advisor.
By continuing, you acknowledge that you have read and agree to our full disclaimer & terms of use and privacy policy.