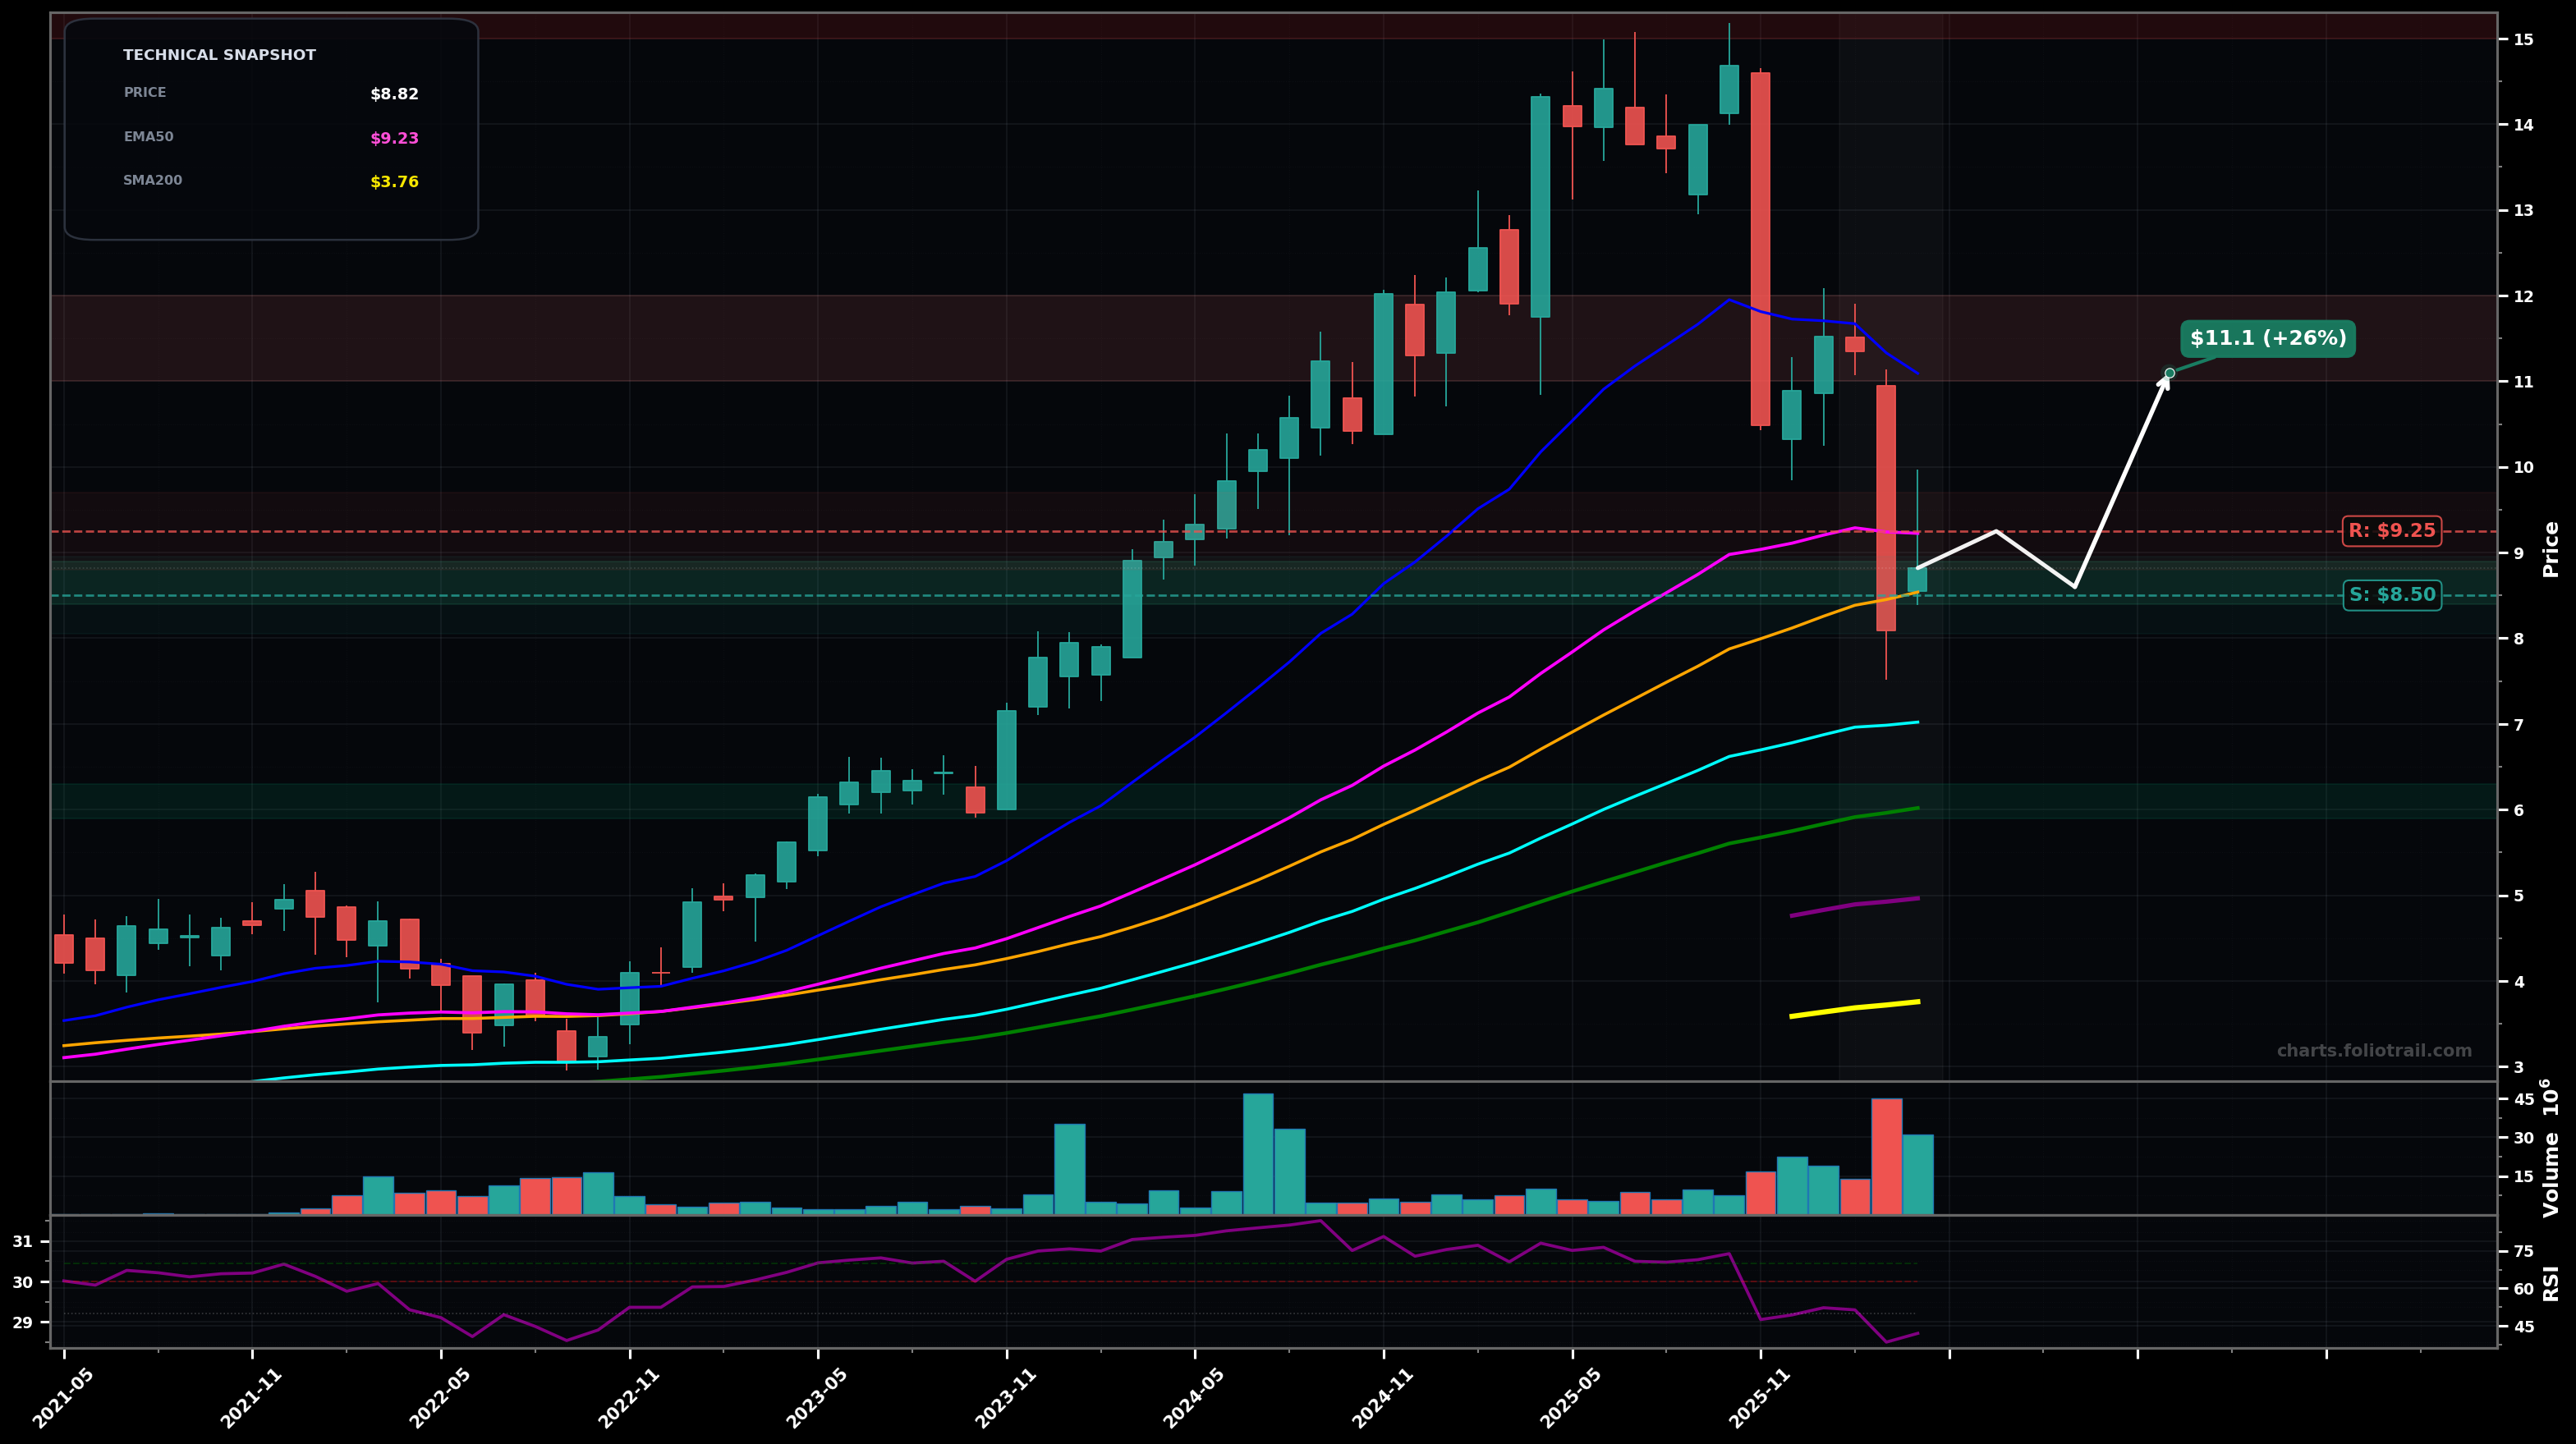
As of April 30, 2026, TGOPY (3i Group plc) is in a bottoming attempt state on the monthly chart, with a confidence level of 58%. Key support is at $8.50 and key resistance at $9.25. Monthly pullback from ~$15 area with a large sell candle; price now ~$8.82 sitting around the rising SMA50 (~$8.54) and just under EMA50 (~$9.23); RSI14 ~42 (momentum cooled).
Base-and-bounce: price holds ~$8.5 and reclaims EMA50; corrective structure likely finishes as an ABC, targeting the prior breakdown zone first.
Deeper correction: failure to reclaim EMA50 leads to another leg down toward EMA100; larger trend still intact unless EMA100 breaks decisively.
2 monthly closes back above $9.23 (EMA50) and holding above $8.54 (SMA50).
Monthly close below $7.60 (loss of the recent swing-support zone and failure to hold above EMA100 vicinity).
Start near SMA50 support ($8.54); add at EMA100 confluence (~$7.02); heavy add near deeper fib/mean-reversion zone around ~$6 with invalidation if the larger base fails.
Trim into prior supply/previous highs ($11-12 then $13.5-14.8); fully close into retest/extension above the ~$15 peak where prior distribution occurred.
As of April 30, 2026, TGOPY (3i Group plc) is in a bottoming attempt state on the monthly chart with 58% confidence. Monthly pullback from ~$15 area with a large sell candle; price now ~$8.82 sitting around the rising SMA50 (~$8.54) and just under EMA50 (~$9.23); RSI14 ~42 (momentum cooled).
On the monthly timeframe, TGOPY has key support at $8.50 and key resistance at $9.25. The most likely scenario (bullish) targets $9.25 and $11.1, with a revert level at $8.60.
TGOPY (3i Group plc) is currently classified as bottoming attempt on the monthly chart, with 58% confidence. Confirmation requires: 2 monthly closes back above $9.23 (EMA50) and holding above $8.54 (SMA50). This would be invalidated by: Monthly close below $7.60 (loss of the recent swing-support zone and failure to hold above EMA100 vicinity).
The most likely scenario (bullish) targets $9.25 and $11.1, with a revert level at $8.60. The alternative scenario (bearish) targets $7.05 and $6.00.
Multi-layer AI agents analyse 200+ stocks across daily, weekly, and monthly timeframes — producing market state classifications, price scenarios with targets, and position entry/exit levels. Daily charts updated every trading day at 6 PM ET. Weekly charts refresh Fridays. Monthly charts refresh on the last trading day of each month. No paywall. No sign-up required.
Built by Foliotrail.
All content on this website — including charts, analysis, price targets, support/resistance levels, and position zones — is generated entirely by AI and provided for educational and informational purposes only.
This is not financial advice. NEXUSNOIR VENTURES SL (the operator of this website) is not a registered investment adviser or broker-dealer. You should not make investment decisions based solely on this information. Always do your own research and consult a qualified financial advisor.
By continuing, you acknowledge that you have read and agree to our full disclaimer & terms of use and privacy policy.