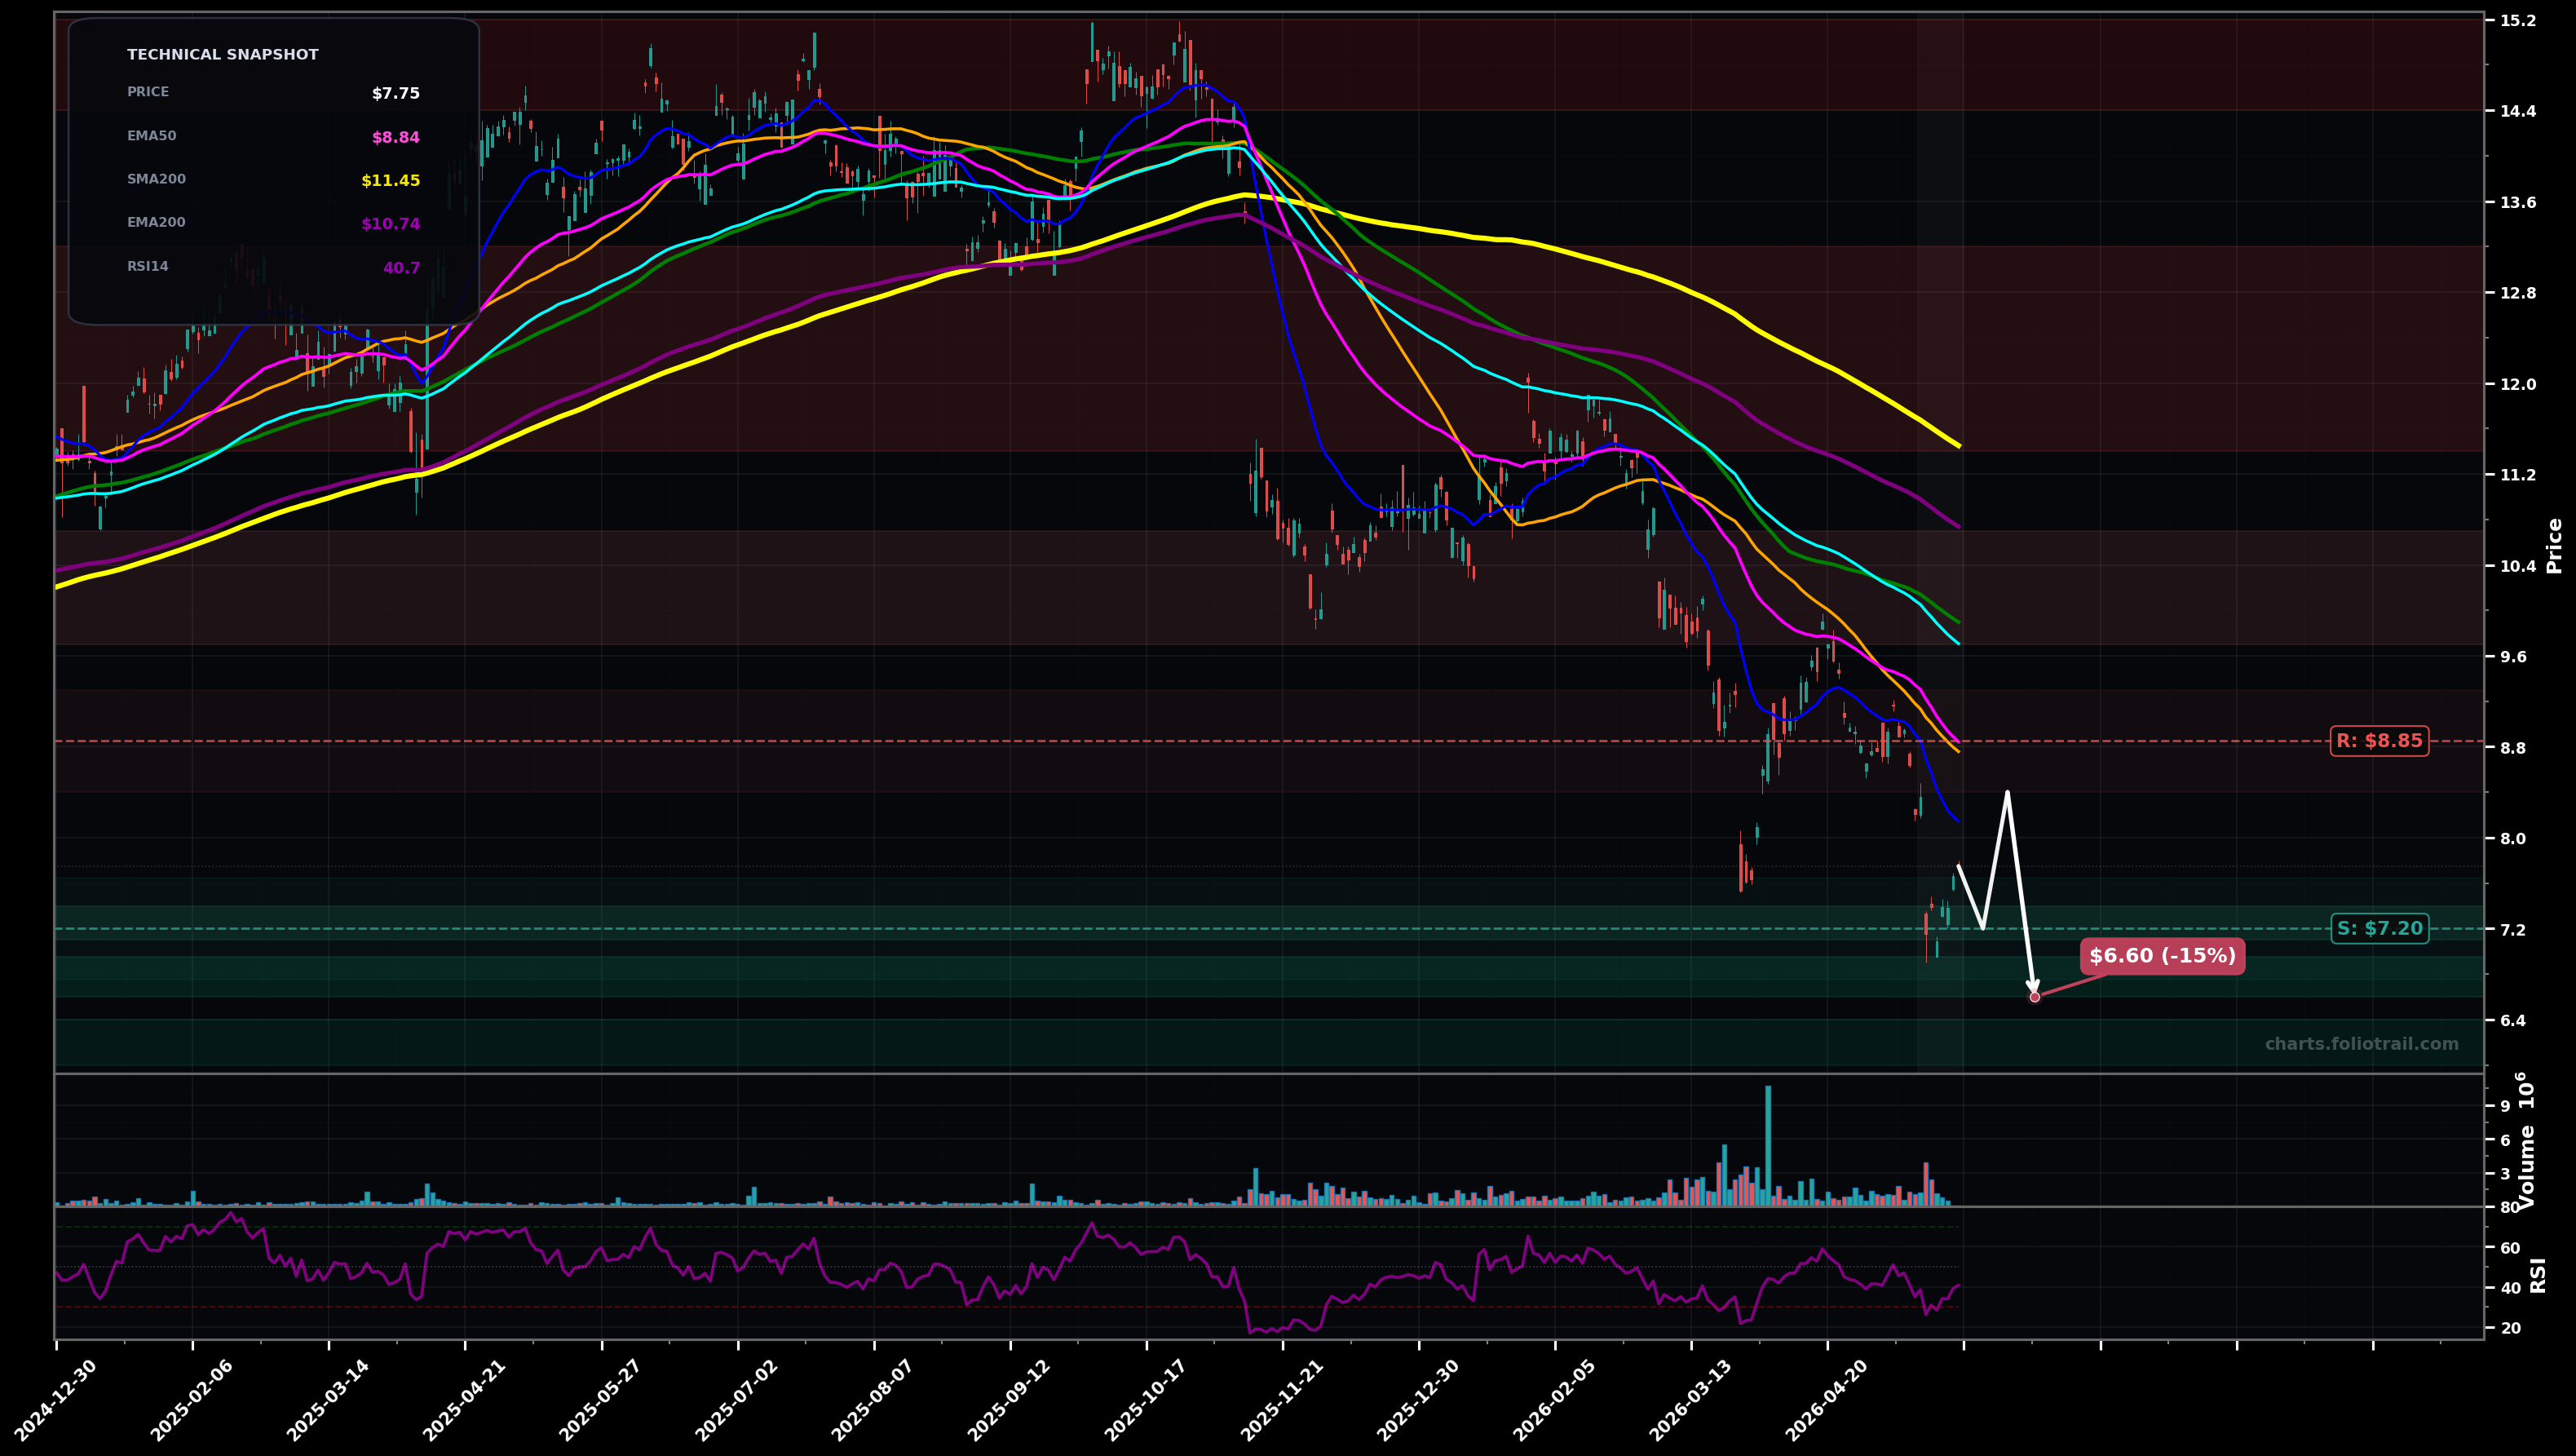
As of May 22, 2026, TGOPY (3i Group plc) is in a falling knife state on the daily chart, with a confidence level of 73%. Key support is at $7.20 and key resistance at $8.85. Sharp selloff into new lows followed by a small bounce; price ($7.75) remains well below all key MAs with RSI ~41 (weak relief, not a reversal).
Bearish continuation: bounce stalls under EMA50/near prior breakdown level, then retest and marginally undercut the $7.2 support before any meaningful base forms (Elliott: still in a late Wave 3 / early Wave 5 down; Fibonacci: typical 0.382–0.5 retrace of the last downswing capped under ~$8.8–$9.7).
Relief rally / bottoming attempt: price holds above $7.2 and grinds up to test the EMA50 then EMA100; would be treated as a counter-trend Wave 4 bounce unless it can reclaim and hold above the $9–$10 supply zone (Fib: 0.5–0.618 retrace zone aligns with the $9.7–$10.7 MA cluster).
Daily close below $7.20 (break of the current swing-low area) with follow-through.
Two consecutive daily closes above $8.85 (reclaim/hold above EMA50).
Scale near the current swing-low support ($7.2) and add on capitulation-style extensions to next Fib/round-number supports; trend is down so entries are tactical and size-controlled until EMA50 is reclaimed.
Trim into the stacked MA supply (EMA100/EMA200/SMA100–200 zones) and major prior distribution highs where rallies often fail in downtrends; full exit if price returns to the prior peak area without a clean long-term trend rebuild.
As of May 22, 2026, TGOPY (3i Group plc) is in a falling knife state on the daily chart with 73% confidence. Sharp selloff into new lows followed by a small bounce; price ($7.75) remains well below all key MAs with RSI ~41 (weak relief, not a reversal).
On the daily timeframe, TGOPY has key support at $7.20 and key resistance at $8.85. The most likely scenario (bearish) targets $7.20 and $6.60, with a revert level at $8.40.
TGOPY (3i Group plc) is currently classified as falling knife on the daily chart, with 73% confidence. Confirmation requires: Daily close below $7.20 (break of the current swing-low area) with follow-through. This would be invalidated by: Two consecutive daily closes above $8.85 (reclaim/hold above EMA50).
The most likely scenario (bearish) targets $7.20 and $6.60, with a revert level at $8.40. The alternative scenario (bullish) targets $8.85 and $9.70.
Multi-layer AI agents analyse 200+ stocks across daily, weekly, and monthly timeframes — producing market state classifications, price scenarios with targets, and position entry/exit levels. Daily charts updated every trading day at 6 PM ET. Weekly charts refresh Fridays. Monthly charts refresh on the last trading day of each month. No paywall. No sign-up required.
Built by Foliotrail.
All content on this website — including charts, analysis, price targets, support/resistance levels, and position zones — is generated entirely by AI and provided for educational and informational purposes only.
This is not financial advice. NEXUSNOIR VENTURES SL (the operator of this website) is not a registered investment adviser or broker-dealer. You should not make investment decisions based solely on this information. Always do your own research and consult a qualified financial advisor.
By continuing, you acknowledge that you have read and agree to our full disclaimer & terms of use and privacy policy.