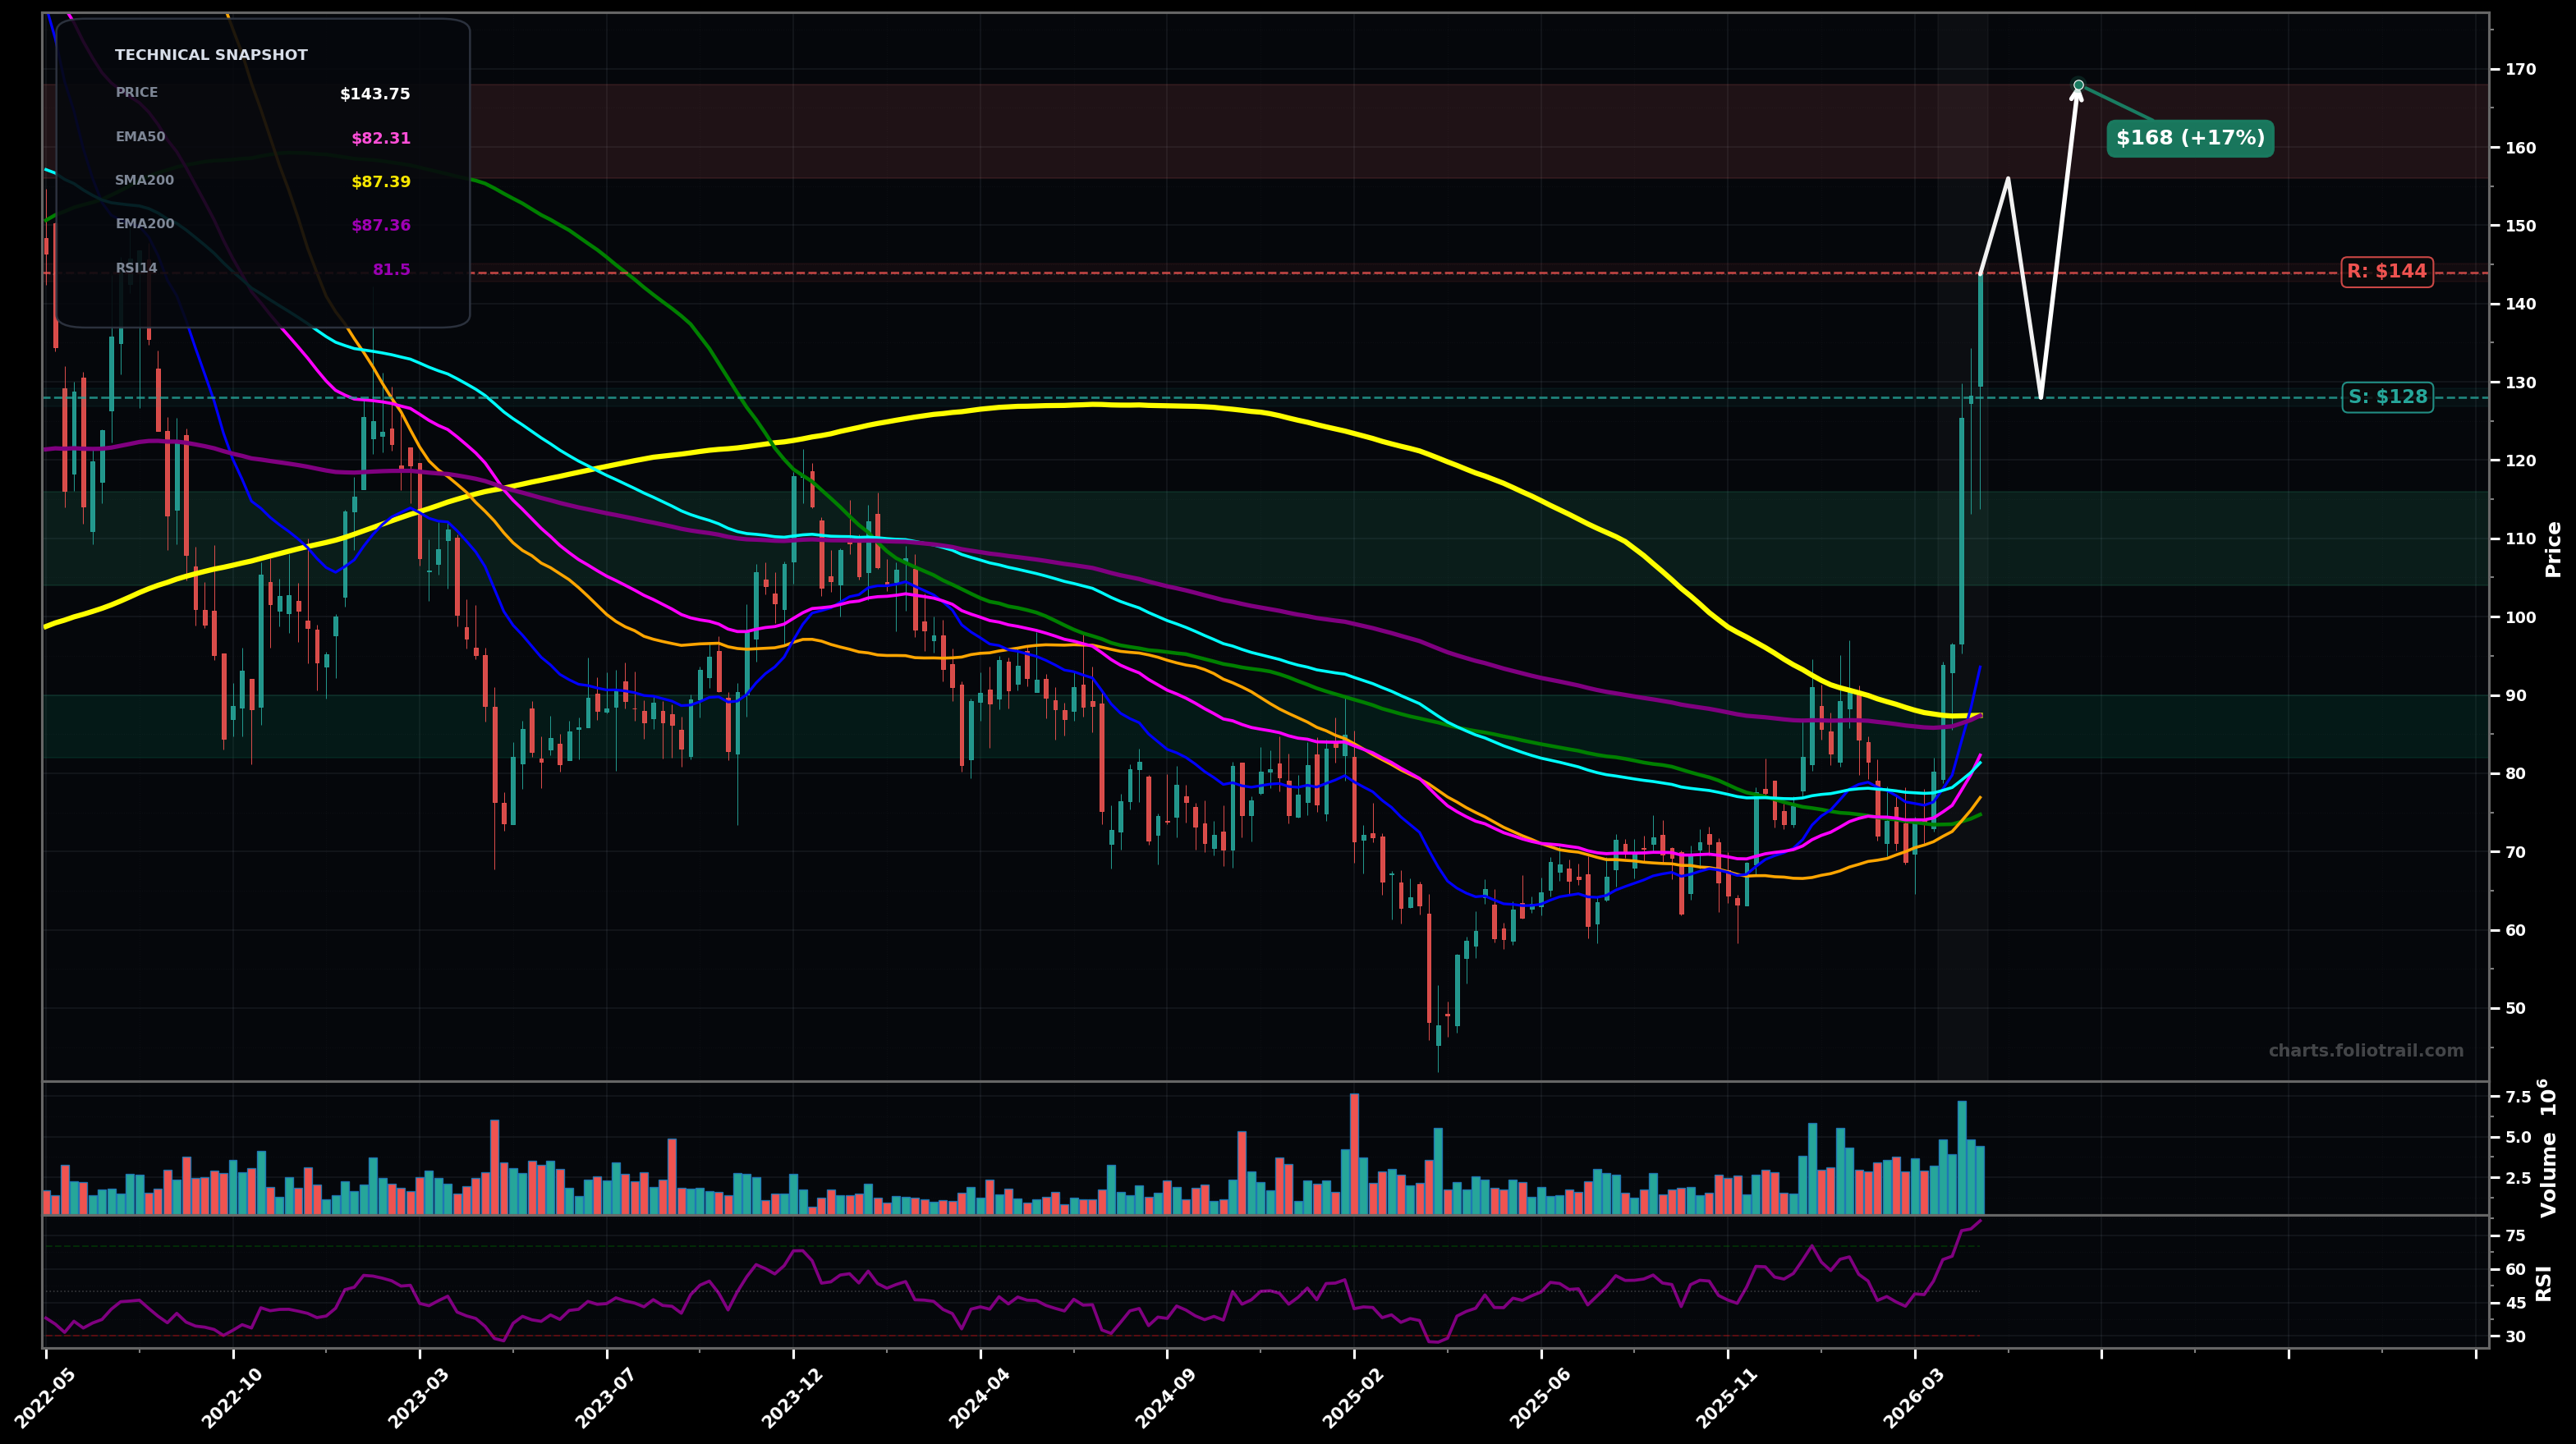
As of May 22, 2026, SYNA (Synaptics Incorporated) is in a parabolic state on the weekly chart, with a confidence level of 82%. Key support is at $128 and key resistance at $144. Explosive weekly breakout to ~$143.75 with a near-vertical advance; RSI ~81.6 (overbought) and price massively extended above all key MAs.
Parabolic continuation: price consolidates briefly above the breakout zone then makes one more push higher (Elliott: likely wave 3 extension with a short wave 4 pause). Fibonacci from the last base (~$72) to current high (~$144) implies next magnet zone around 1.272–1.618 extension.
Blow-off then mean-reversion: sharp pullback/weekly wick sells into the gap area, retesting prior resistance and fast MAs (Elliott: wave 4 retrace of the impulse; Fib retrace likely 0.382–0.5 of the ~$72→$144 leg).
Weekly close holds above ~$128 (breakout gap/impulse base) for 2+ weeks
Weekly close back below ~$112 (loss of impulse and failure of breakout structure)
Buying interest focuses on likely wave-4 retrace zones and prior MA cluster: ~$116/$104 (0.382–0.5), then deeper mean reversion toward ~$96 and the EMA/SMA band ~$82–$90 (EMA50/100/200 + SMA200 region on chart).
Trims mapped to likely extension/overstretch zones after a parabolic move (Fib extensions and psychological levels), where risk of a multi-month cooldown rises materially.
As of May 22, 2026, SYNA (Synaptics Incorporated) is in a parabolic state on the weekly chart with 82% confidence. Explosive weekly breakout to ~$143.75 with a near-vertical advance; RSI ~81.6 (overbought) and price massively extended above all key MAs.
On the weekly timeframe, SYNA has key support at $128 and key resistance at $144. The most likely scenario (bullish) targets $156 and $168, with a revert level at $128.
SYNA (Synaptics Incorporated) is currently classified as parabolic on the weekly chart, with 82% confidence. Confirmation requires: Weekly close holds above ~$128 (breakout gap/impulse base) for 2+ weeks This would be invalidated by: Weekly close back below ~$112 (loss of impulse and failure of breakout structure)
The most likely scenario (bullish) targets $156 and $168, with a revert level at $128. The alternative scenario (bearish) targets $116 and $104.
Multi-layer AI agents analyse 200+ stocks across daily, weekly, and monthly timeframes — producing market state classifications, price scenarios with targets, and position entry/exit levels. Daily charts updated every trading day at 6 PM ET. Weekly charts refresh Fridays. Monthly charts refresh on the last trading day of each month. No paywall. No sign-up required.
Built by Foliotrail.
All content on this website — including charts, analysis, price targets, support/resistance levels, and position zones — is generated entirely by AI and provided for educational and informational purposes only.
This is not financial advice. NEXUSNOIR VENTURES SL (the operator of this website) is not a registered investment adviser or broker-dealer. You should not make investment decisions based solely on this information. Always do your own research and consult a qualified financial advisor.
By continuing, you acknowledge that you have read and agree to our full disclaimer & terms of use and privacy policy.