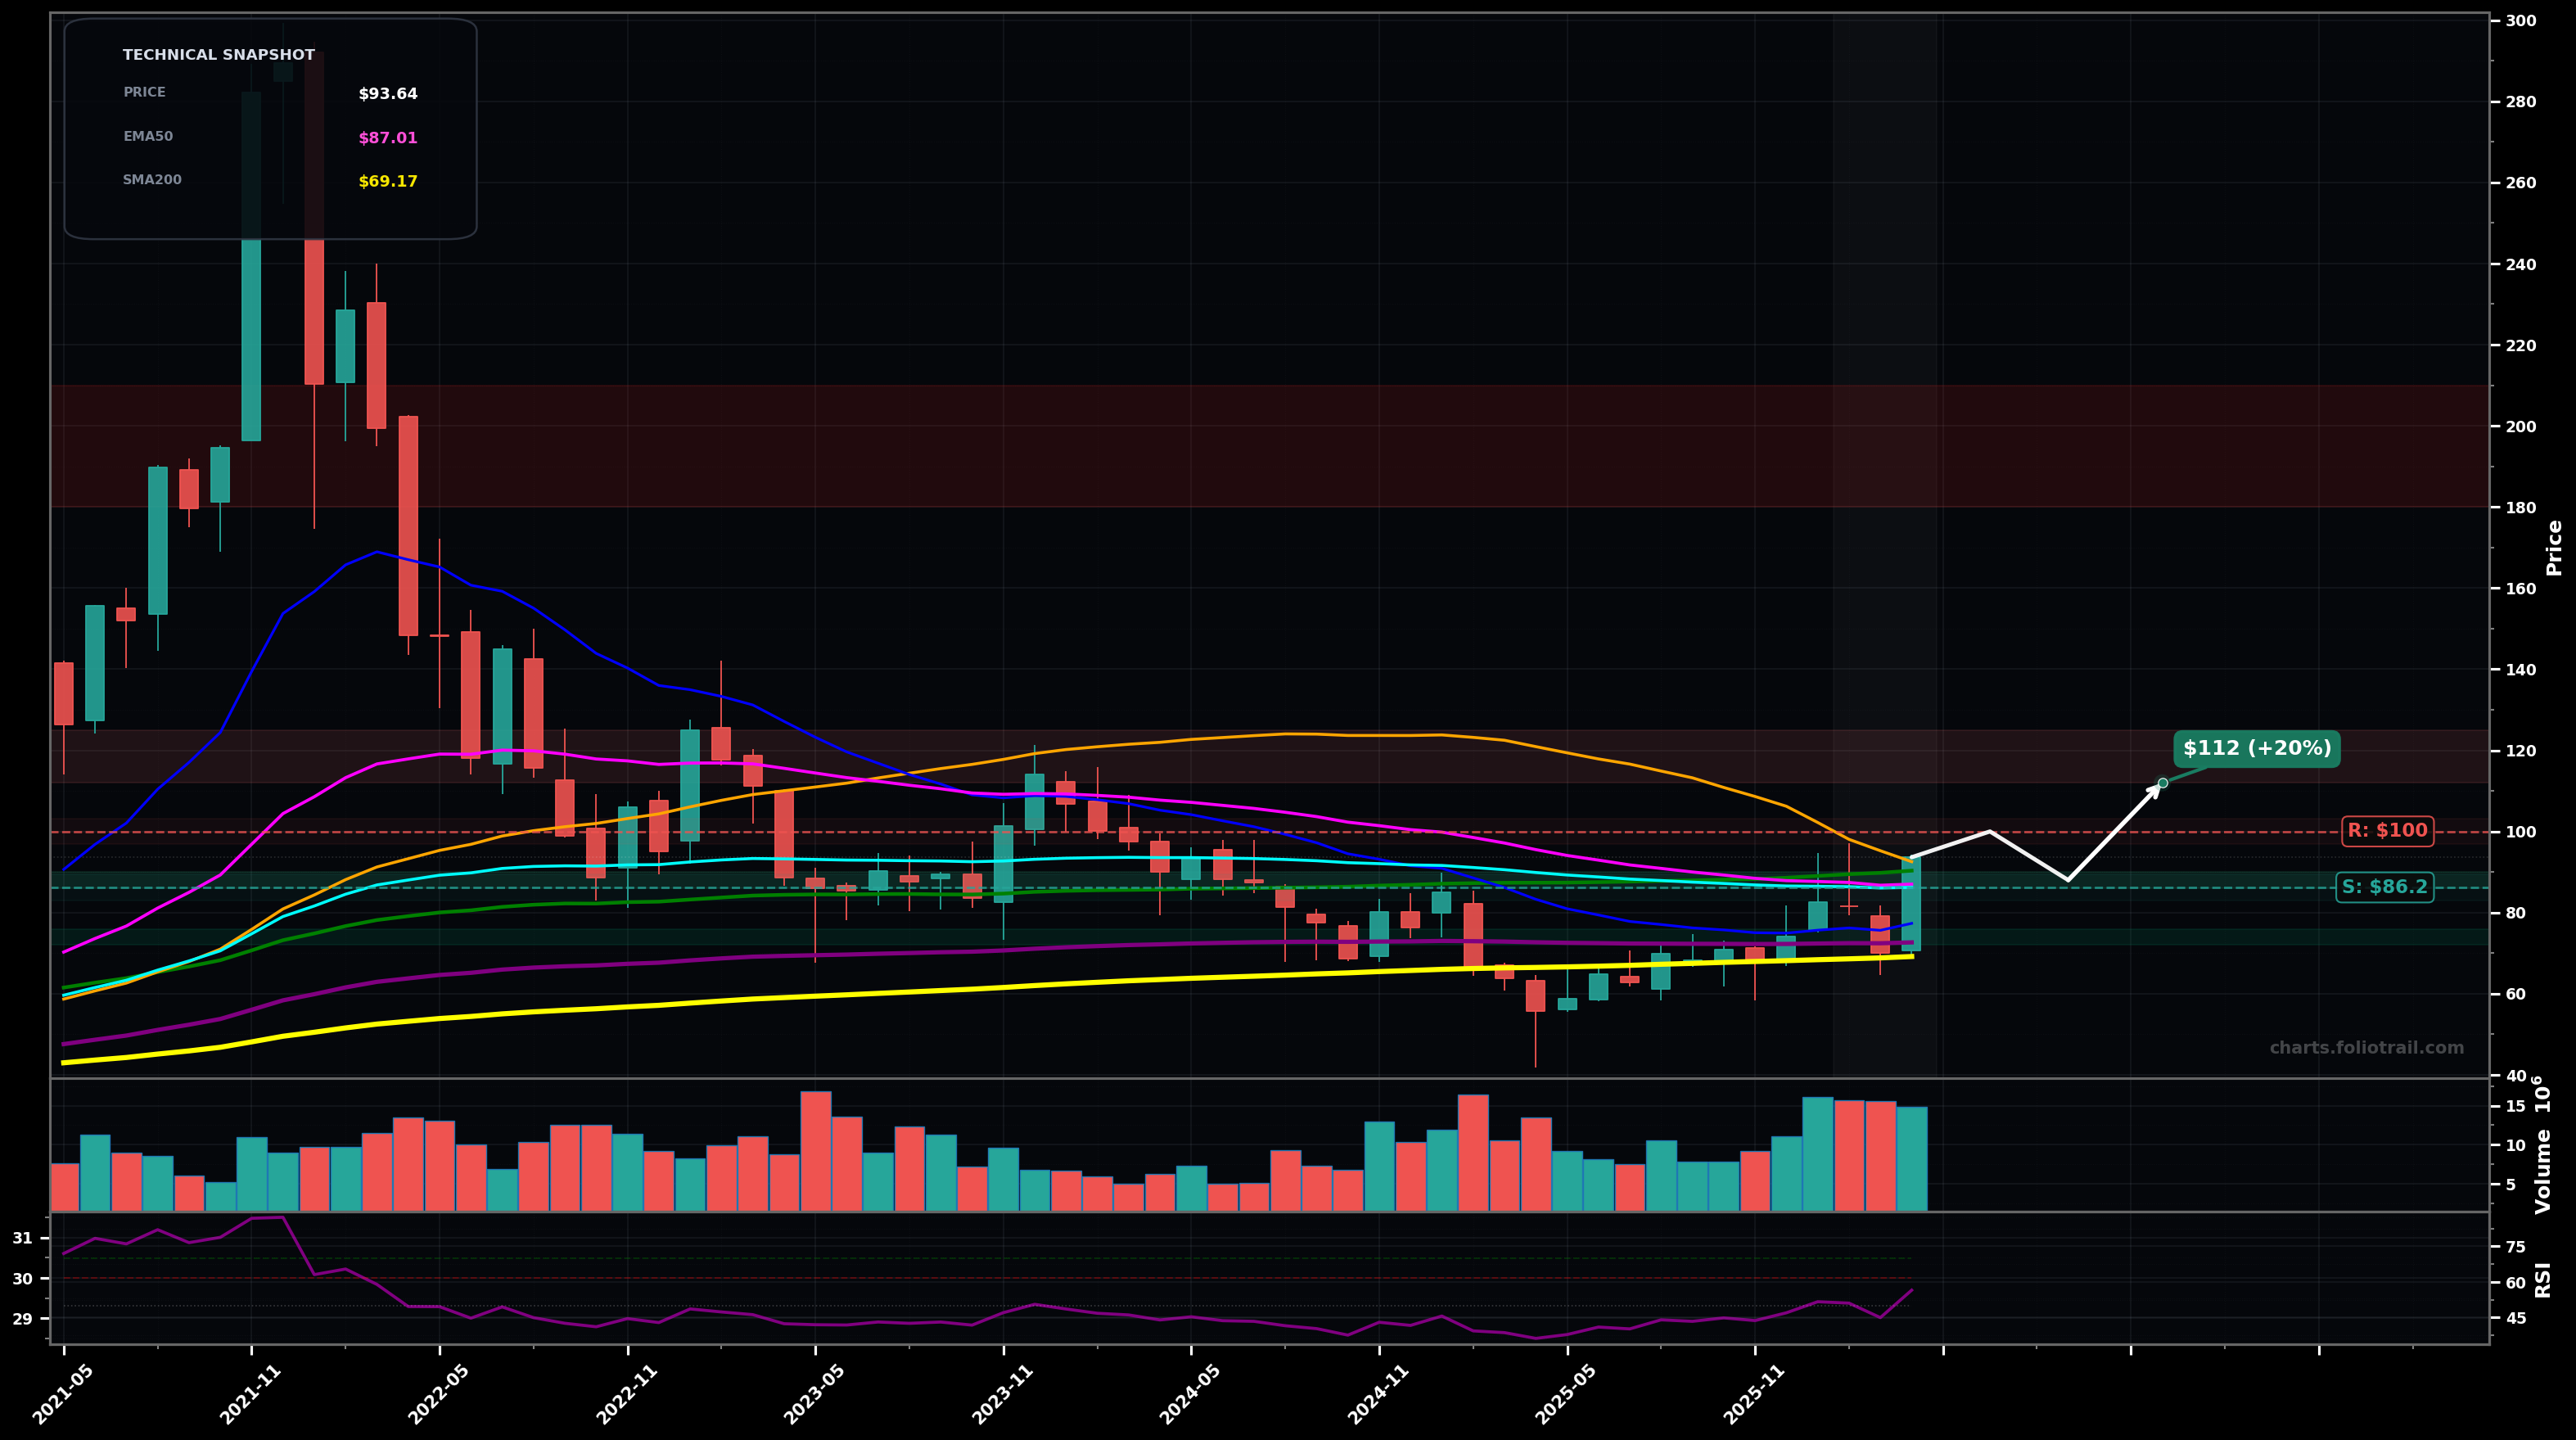
As of April 30, 2026, SYNA (Synaptics Incorporated) is in a breakout reversal state on the monthly chart, with a confidence level of 62%. Key support is at $86.2 and key resistance at $100. Monthly rebound into a tight resistance band; price $93.64 sits above EMA50/EMA100 and just above SMA50 after a prior multi-year decline, with RSI ~56.5 improving.
Bullish continuation: breakout holds above EMA50/EMA100 and grinds higher toward the next supply zone; likely a pullback/retest first, then a push into $100+ and toward the declining long MAs.
Bearish rejection: price fails at the $95-$100 supply band and loses EMA50/EMA100 support, rotating back into the prior base and possibly testing the major long-term MA cluster below.
Monthly close above $95.00 followed by a second close holding above $95.00
Monthly close back below $86.00
Start on EMA50/EMA100 retest, add on range support, heavy add near EMA200 ($72.65) + prior swing-base area if a deeper pullback occurs.
Trim into major overhead supply/MA zones: first near prior breakdown area (~$112-$125), then toward the bigger 2022-2023 distribution (~$140-$160); fully close if price mean-reverts into the old upper range ($180+).
As of April 30, 2026, SYNA (Synaptics Incorporated) is in a breakout reversal state on the monthly chart with 62% confidence. Monthly rebound into a tight resistance band; price $93.64 sits above EMA50/EMA100 and just above SMA50 after a prior multi-year decline, with RSI ~56.5 improving.
On the monthly timeframe, SYNA has key support at $86.2 and key resistance at $100. The most likely scenario (bullish) targets $100 and $112, with a revert level at $88.0.
SYNA (Synaptics Incorporated) is currently classified as breakout reversal on the monthly chart, with 62% confidence. Confirmation requires: Monthly close above $95.00 followed by a second close holding above $95.00 This would be invalidated by: Monthly close back below $86.00
The most likely scenario (bullish) targets $100 and $112, with a revert level at $88.0. The alternative scenario (bearish) targets $80.0 and $72.5.
Multi-layer AI agents analyse 200+ stocks across daily, weekly, and monthly timeframes — producing market state classifications, price scenarios with targets, and position entry/exit levels. Daily charts updated every trading day at 6 PM ET. Weekly charts refresh Fridays. Monthly charts refresh on the last trading day of each month. No paywall. No sign-up required.
Built by Foliotrail.
All content on this website — including charts, analysis, price targets, support/resistance levels, and position zones — is generated entirely by AI and provided for educational and informational purposes only.
This is not financial advice. NEXUSNOIR VENTURES SL (the operator of this website) is not a registered investment adviser or broker-dealer. You should not make investment decisions based solely on this information. Always do your own research and consult a qualified financial advisor.
By continuing, you acknowledge that you have read and agree to our full disclaimer & terms of use and privacy policy.