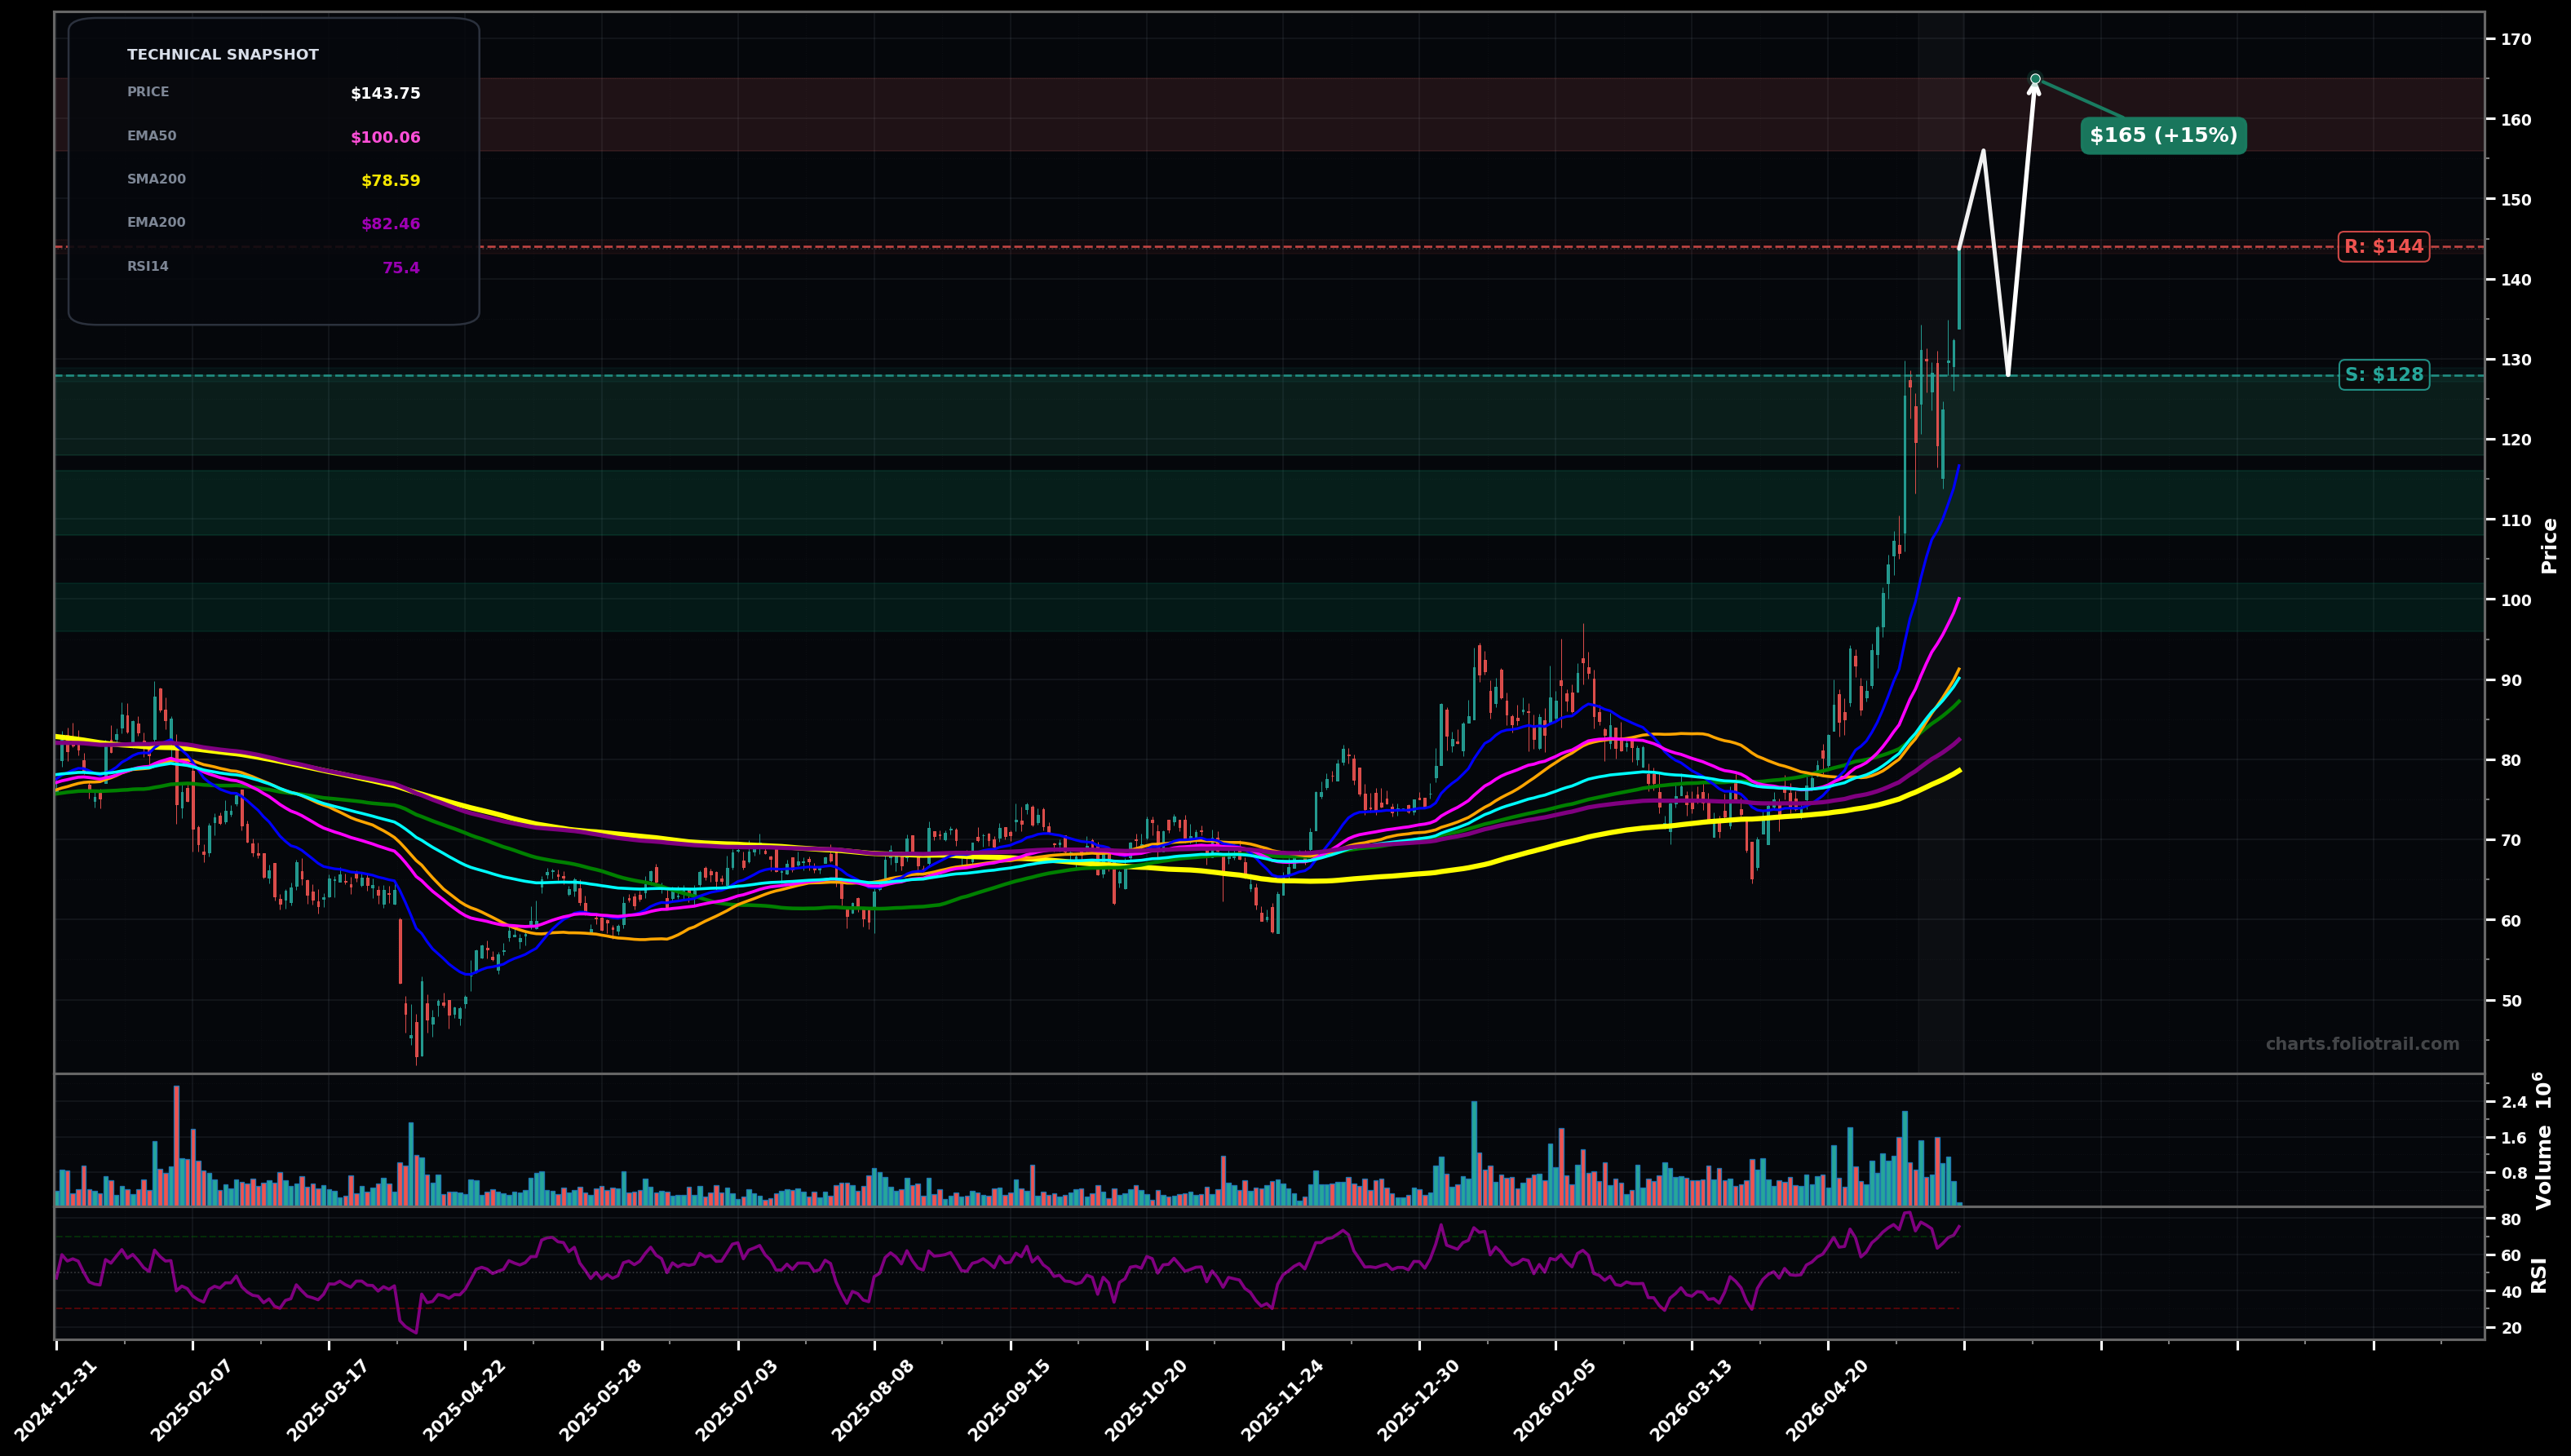
As of May 22, 2026, SYNA (Synaptics Incorporated) is in a parabolic state on the daily chart, with a confidence level of 72%. Key support is at $128 and key resistance at $144. Strong impulsive breakout to new highs; price $143.75 is far above rising EMA50 ($100.06) & EMA100 ($90.13) with expanding ranges; RSI14 ~75 (extended).
Continuation of the impulse (Elliott: late wave 3 / start of wave 5 feel) with brief consolidation, then another push higher; Fibonacci extension from the prior base projects into mid-$150s then low-$160s.
Parabolic pullback / mean reversion: profit-taking drives a retrace toward the rising EMA20/EMA50 zone; if $128 breaks, downside can test $116 then $100 (EMA50) as wave-4 style correction before trend decision.
2+ daily closes above $144 (break/hold of current high zone) while staying above $128
Daily close below $116 (loss of breakout structure + near EMA20 ~$116.67)
Buy-the-dip plan around prior breakout/pivot support (~$128), then EMA20/structure (~$116), then EMA50 confluence (~$100) if a deeper wave-4 retrace occurs.
Trim into Fibonacci extension zones above current impulse (parabolic/RSI>70); scale heavier as price gets increasingly detached from rising EMA50/EMA100 and volatility expands.
As of May 22, 2026, SYNA (Synaptics Incorporated) is in a parabolic state on the daily chart with 72% confidence. Strong impulsive breakout to new highs; price $143.75 is far above rising EMA50 ($100.06) & EMA100 ($90.13) with expanding ranges; RSI14 ~75 (extended).
On the daily timeframe, SYNA has key support at $128 and key resistance at $144. The most likely scenario (bullish) targets $156 and $165, with a revert level at $128.
SYNA (Synaptics Incorporated) is currently classified as parabolic on the daily chart, with 72% confidence. Confirmation requires: 2+ daily closes above $144 (break/hold of current high zone) while staying above $128 This would be invalidated by: Daily close below $116 (loss of breakout structure + near EMA20 ~$116.67)
The most likely scenario (bullish) targets $156 and $165, with a revert level at $128. The alternative scenario (bearish) targets $116 and $100.
Multi-layer AI agents analyse 200+ stocks across daily, weekly, and monthly timeframes — producing market state classifications, price scenarios with targets, and position entry/exit levels. Daily charts updated every trading day at 6 PM ET. Weekly charts refresh Fridays. Monthly charts refresh on the last trading day of each month. No paywall. No sign-up required.
Built by Foliotrail.
All content on this website — including charts, analysis, price targets, support/resistance levels, and position zones — is generated entirely by AI and provided for educational and informational purposes only.
This is not financial advice. NEXUSNOIR VENTURES SL (the operator of this website) is not a registered investment adviser or broker-dealer. You should not make investment decisions based solely on this information. Always do your own research and consult a qualified financial advisor.
By continuing, you acknowledge that you have read and agree to our full disclaimer & terms of use and privacy policy.