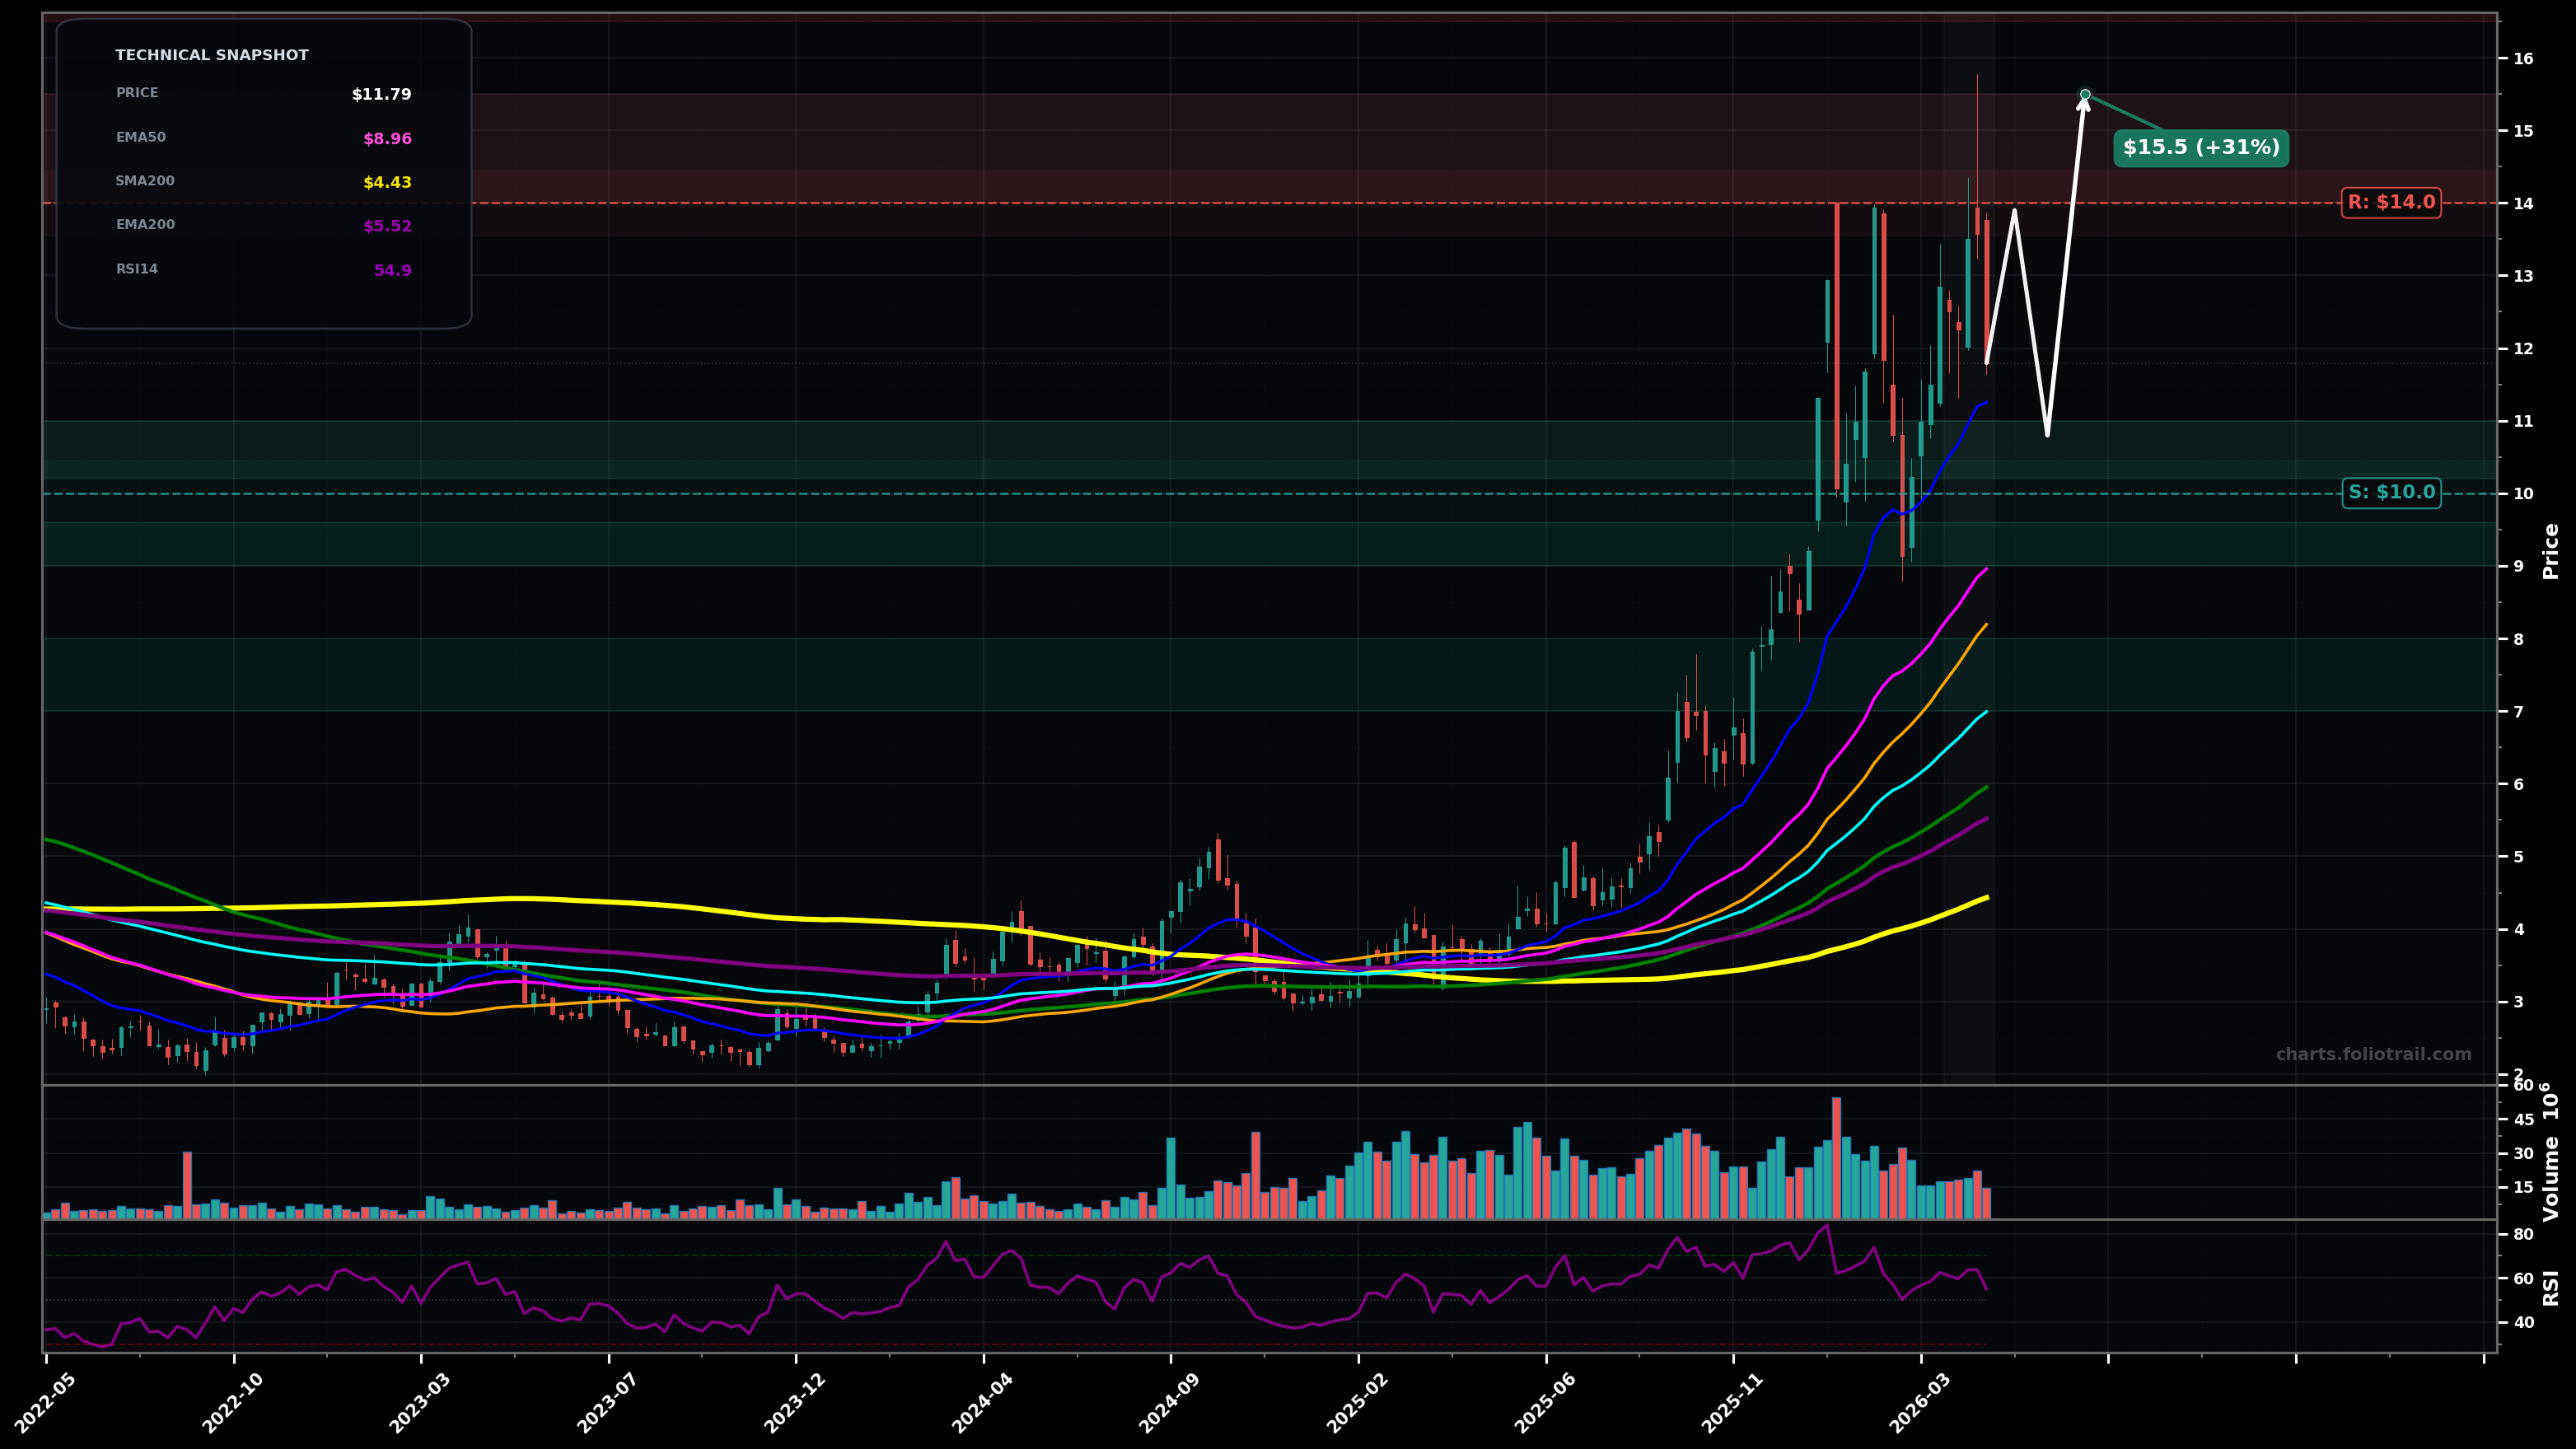
As of May 22, 2026, SVM (Silvercorp Metals Inc.) is in a uptrend state on the weekly chart, with a confidence level of 67%. Key support is at $10.0 and key resistance at $14.0. After a strong impulse up, price is consolidating with sharp weekly swings; last print around $11.79 sits above rising EMA50 ($8.96) and EMA100 ($6.99) with RSI ~55 (cooling).
Bullish continuation: consolidation resolves higher; price holds the $10-$11 area (prior breakout zone/short-term demand) then retests the prior highs and attempts a new HH. Rough probability 60%.
Deeper pullback within uptrend: a failed attempt to reclaim $13-$14 leads to a shakeout toward the rising EMA50/EMA20 cluster, then a decision point (either HL bounce or trend break). Rough probability 40%.
Weekly close above $13.90
Weekly close below $8.90
Start near the $10-$11 demand/structure support; add on EMA50-area pullback (~$9); heavy add only on a deeper HL test toward EMA100/major breakout retest ($7-$8).
Trim into prior-high/extension zone ($14-$15.5); heavier trims if price goes vertical and extends far above EMA50; full exit only on multi-year-style euphoric overshoot well beyond prior range.
As of May 22, 2026, SVM (Silvercorp Metals Inc.) is in a uptrend state on the weekly chart with 67% confidence. After a strong impulse up, price is consolidating with sharp weekly swings; last print around $11.79 sits above rising EMA50 ($8.96) and EMA100 ($6.99) with RSI ~55 (cooling).
On the weekly timeframe, SVM has key support at $10.0 and key resistance at $14.0. The most likely scenario (bullish) targets $13.9 and $15.5, with a revert level at $10.8.
SVM (Silvercorp Metals Inc.) is currently classified as uptrend on the weekly chart, with 67% confidence. Confirmation requires: Weekly close above $13.90 This would be invalidated by: Weekly close below $8.90
The most likely scenario (bullish) targets $13.9 and $15.5, with a revert level at $10.8. The alternative scenario (bearish) targets $9.00 and $7.00.
Multi-layer AI agents analyse 200+ stocks across daily, weekly, and monthly timeframes — producing market state classifications, price scenarios with targets, and position entry/exit levels. Daily charts updated every trading day at 6 PM ET. Weekly charts refresh Fridays. Monthly charts refresh on the last trading day of each month. No paywall. No sign-up required.
Built by Foliotrail.
All content on this website — including charts, analysis, price targets, support/resistance levels, and position zones — is generated entirely by AI and provided for educational and informational purposes only.
This is not financial advice. NEXUSNOIR VENTURES SL (the operator of this website) is not a registered investment adviser or broker-dealer. You should not make investment decisions based solely on this information. Always do your own research and consult a qualified financial advisor.
By continuing, you acknowledge that you have read and agree to our full disclaimer & terms of use and privacy policy.