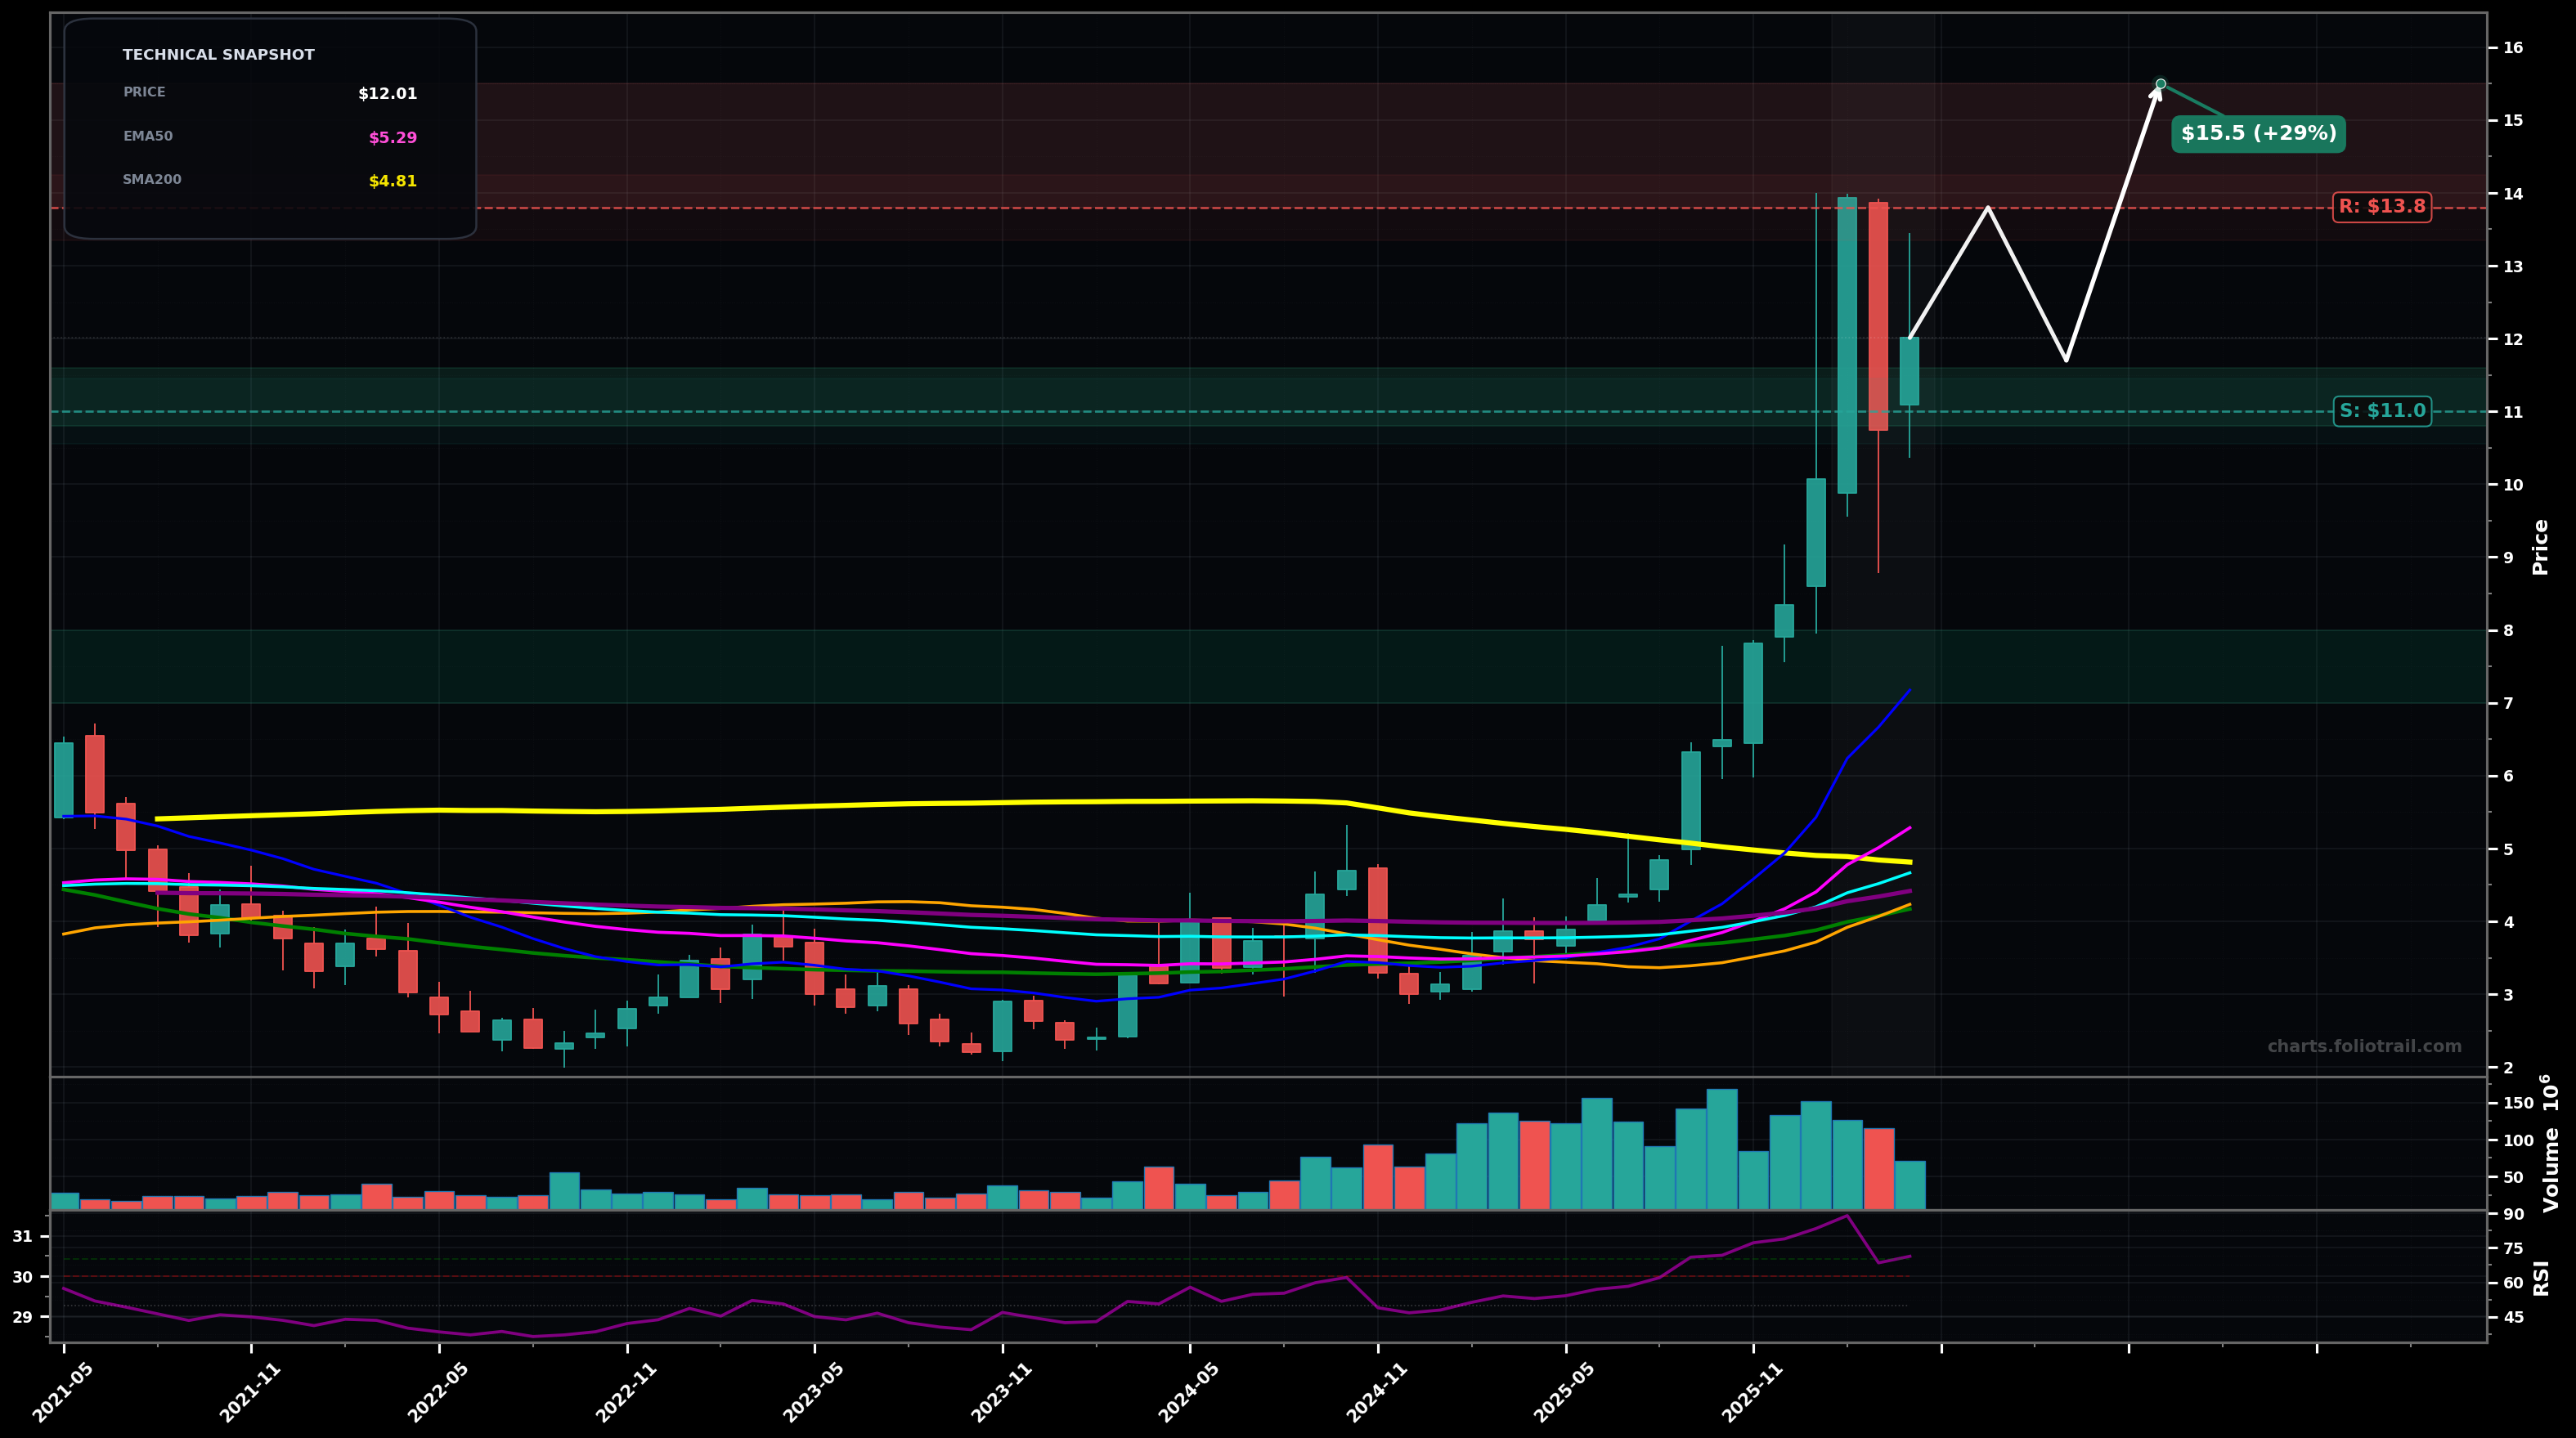
As of April 30, 2026, SVM (Silvercorp Metals Inc.) is in a volatility expansion state on the monthly chart, with a confidence level of 76%. Key support is at $11.0 and key resistance at $13.8. Monthly breakout turned into volatility expansion: sharp vertical run to ~$14, then a big pullback and partial bounce; price still well above all key MAs with RSI ~71 (overbought regime).
Bullish consolidation after the spike: price chops between ~$11 and ~$13.8, then resumes trend to retest the prior high area; this fits an Elliott Wave view of a wave (4) consolidation before a wave (5) attempt. Fib-wise, current pullback looks like a normal retrace of the impulse with buyers defending the mid-zone rather than full mean reversion to EMA50.
Deeper mean-reversion: the post-spike drop is the start of a larger ABC correction; price loses ~$11 and retraces toward the breakout base/major MA cluster (EMA200~$4.4 to EMA50~$5.3) with a likely pause at the psychological/structure zone near ~$10, then potentially a second leg down.
Hold above $11.00 on a monthly closing basis and push back through $13.50
Monthly close below $10.00 (break of post-spike structure and likely deeper retrace)
Start near the first post-spike support (~$11), add on a failed-bounce/structure break retest near ~$10, heavy add only on a larger Fib retrace/mean-reversion toward prior consolidation levels (~$7–$8).
Trim into prior-high retest and extension (RSI/price stretched), trim more on a clear wave-(5) blow-off extension, and fully close if price reaches multi-year euphoric extension far above all MAs.
As of April 30, 2026, SVM (Silvercorp Metals Inc.) is in a volatility expansion state on the monthly chart with 76% confidence. Monthly breakout turned into volatility expansion: sharp vertical run to ~$14, then a big pullback and partial bounce; price still well above all key MAs with RSI ~71 (overbought regime).
On the monthly timeframe, SVM has key support at $11.0 and key resistance at $13.8. The most likely scenario (bullish) targets $13.8 and $15.5, with a revert level at $11.7.
SVM (Silvercorp Metals Inc.) is currently classified as volatility expansion on the monthly chart, with 76% confidence. Confirmation requires: Hold above $11.00 on a monthly closing basis and push back through $13.50 This would be invalidated by: Monthly close below $10.00 (break of post-spike structure and likely deeper retrace)
The most likely scenario (bullish) targets $13.8 and $15.5, with a revert level at $11.7. The alternative scenario (bearish) targets $10.0 and $7.20.
Multi-layer AI agents analyse 200+ stocks across daily, weekly, and monthly timeframes — producing market state classifications, price scenarios with targets, and position entry/exit levels. Daily charts updated every trading day at 6 PM ET. Weekly charts refresh Fridays. Monthly charts refresh on the last trading day of each month. No paywall. No sign-up required.
Built by Foliotrail.
All content on this website — including charts, analysis, price targets, support/resistance levels, and position zones — is generated entirely by AI and provided for educational and informational purposes only.
This is not financial advice. NEXUSNOIR VENTURES SL (the operator of this website) is not a registered investment adviser or broker-dealer. You should not make investment decisions based solely on this information. Always do your own research and consult a qualified financial advisor.
By continuing, you acknowledge that you have read and agree to our full disclaimer & terms of use and privacy policy.