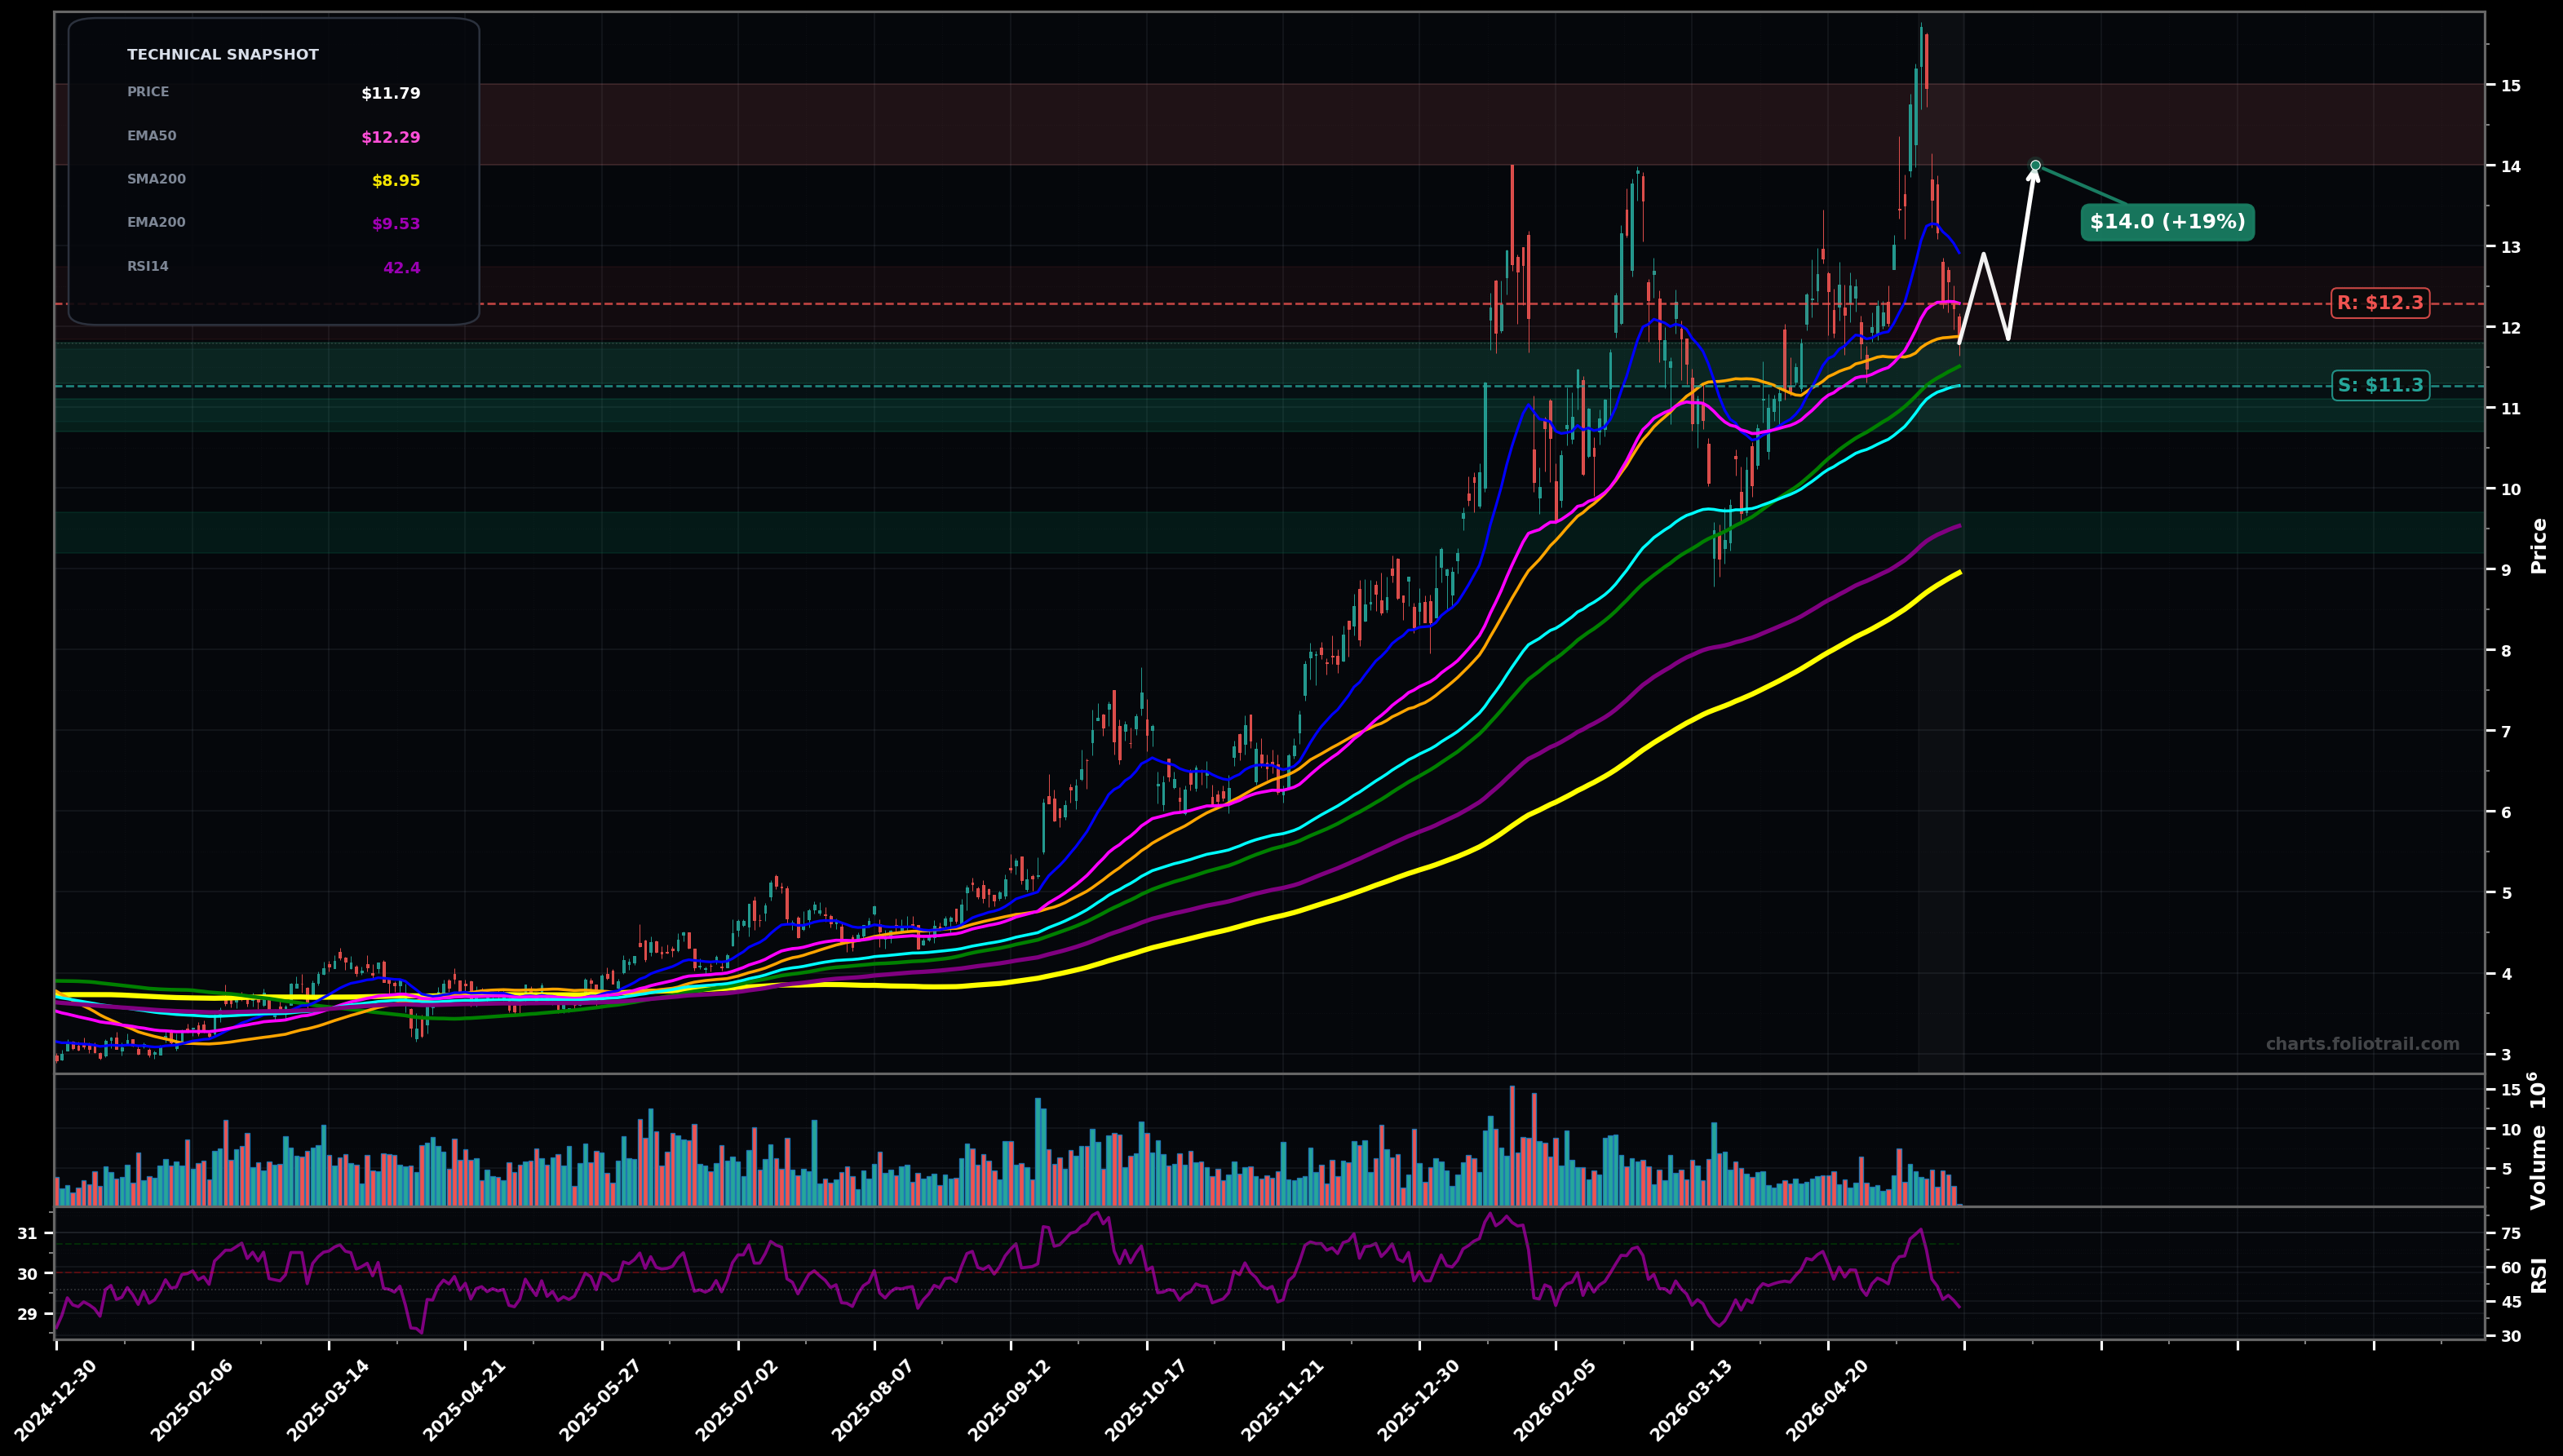
As of May 22, 2026, SVM (Silvercorp Metals Inc.) is in a bottoming attempt state on the daily chart, with a confidence level of 62%. Key support is at $11.3 and key resistance at $12.3. After a sharp push to new highs near ~$15.6, price pulled back hard to $11.79 and is now below the short MAs (SMA50/EMA50) while still above the rising longer-term trend MAs (EMA100/SMA100).
Base-building above EMA100/SMA100, then reclaim EMA50; this would favor a continuation of the larger uptrend (likely Wave 4 consolidation completing, setting up a Wave 5 attempt).
Breakdown through EMA100/SMA100 turns the pullback into a deeper corrective leg (likely ABC), with a mean-reversion test toward the 200-day area before stabilizing.
2+ daily closes back above $12.29 (EMA50) with higher low (HL) intact
Daily close below $11.27 (EMA100) followed by continuation under $11.00
Start near EMA100/SMA100 confluence; add on confirmed loss/retest of $11 area; heavy add only near EMA200 (~$9.53) where prior trend buyers typically defend.
Trim into prior supply/peak zone ($14-$16); close more aggressively on a renewed blow-off above prior highs where upside becomes more extension-driven than trend-supported.
As of May 22, 2026, SVM (Silvercorp Metals Inc.) is in a bottoming attempt state on the daily chart with 62% confidence. After a sharp push to new highs near ~$15.6, price pulled back hard to $11.79 and is now below the short MAs (SMA50/EMA50) while still above the rising longer-term trend MAs (EMA100/SMA100).
On the daily timeframe, SVM has key support at $11.3 and key resistance at $12.3. The most likely scenario (bullish) targets $12.9 and $14.0, with a revert level at $11.8.
SVM (Silvercorp Metals Inc.) is currently classified as bottoming attempt on the daily chart, with 62% confidence. Confirmation requires: 2+ daily closes back above $12.29 (EMA50) with higher low (HL) intact This would be invalidated by: Daily close below $11.27 (EMA100) followed by continuation under $11.00
The most likely scenario (bullish) targets $12.9 and $14.0, with a revert level at $11.8. The alternative scenario (bearish) targets $11.0 and $9.55.
Multi-layer AI agents analyse 200+ stocks across daily, weekly, and monthly timeframes — producing market state classifications, price scenarios with targets, and position entry/exit levels. Daily charts updated every trading day at 6 PM ET. Weekly charts refresh Fridays. Monthly charts refresh on the last trading day of each month. No paywall. No sign-up required.
Built by Foliotrail.
All content on this website — including charts, analysis, price targets, support/resistance levels, and position zones — is generated entirely by AI and provided for educational and informational purposes only.
This is not financial advice. NEXUSNOIR VENTURES SL (the operator of this website) is not a registered investment adviser or broker-dealer. You should not make investment decisions based solely on this information. Always do your own research and consult a qualified financial advisor.
By continuing, you acknowledge that you have read and agree to our full disclaimer & terms of use and privacy policy.